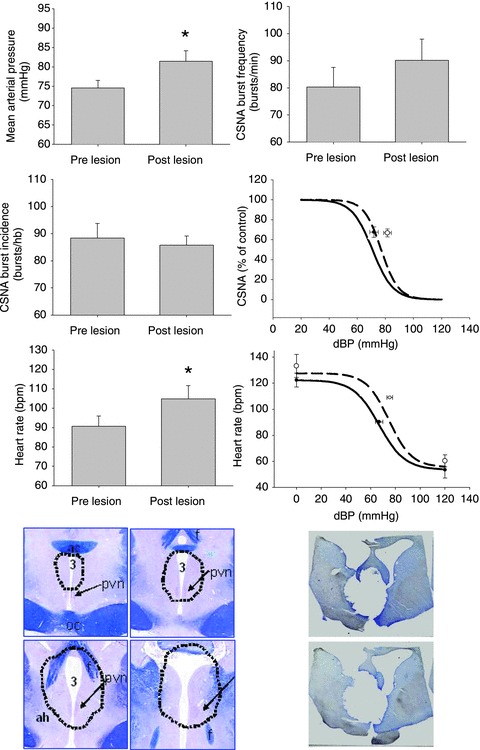
Figure 3. Changes in levels of mean arterial pressure, heart rate, cardiac sympathetic nerve activity and baroreflex control of heart rate and CSNA pre- and post-lesion of the PVN in 5 HF sheep.

Data are means ± SEM; *P < 0.05 pre- vs. post-lesion. The straight lines represent the pre-lesion and the dotted lines represent the post-lesion baroreflex curves. The common area of lesion in all five sheep with HF is denoted below in the first 4 panels on the left. The panels on the right represent sections from one animal showing the lesioned area.
