
Figure 7. Single channel analysis of Drosophila transient receptor potential A1 (dTRPA1).
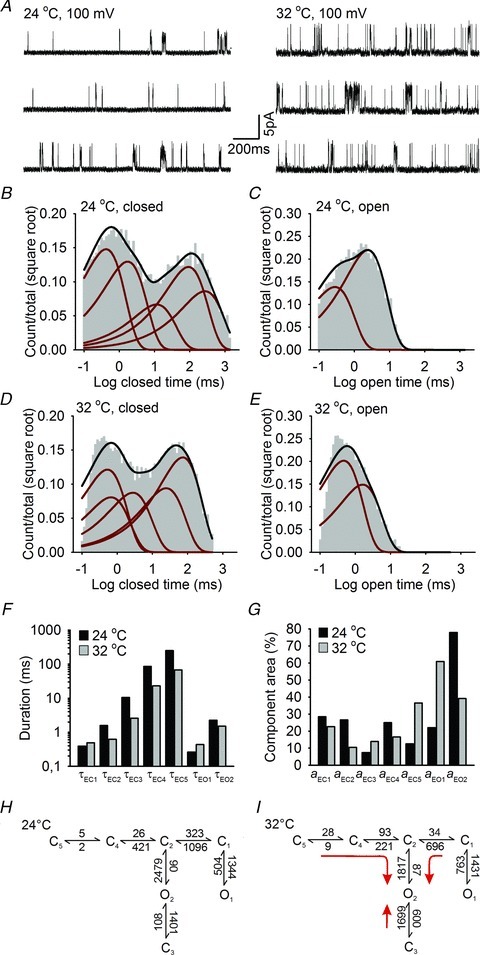
A, examples of dTRPA1 single channel currents recorded at +100 mV and 24°C and 32°C. B–E, histograms of dTRPA1 closed (B) and open distributions (C) at 24°C and 32°C (D and E). Histograms are superimposed with the probability density function (black line) and exponential components (red lines) estimated from fits of a five closed and two open state model. F and G, time constants (F) and areas (G) for the corresponding exponential components of closed (EC1–EC5) and open (EO1–EO2) distributions at 24°C and 32°C. H and I, highest ranking kinetic models of dTRPA1 single channel activity at 24°C and 32°C. Rates are in s−1, red arrows indicate the principal transitions upon heating.