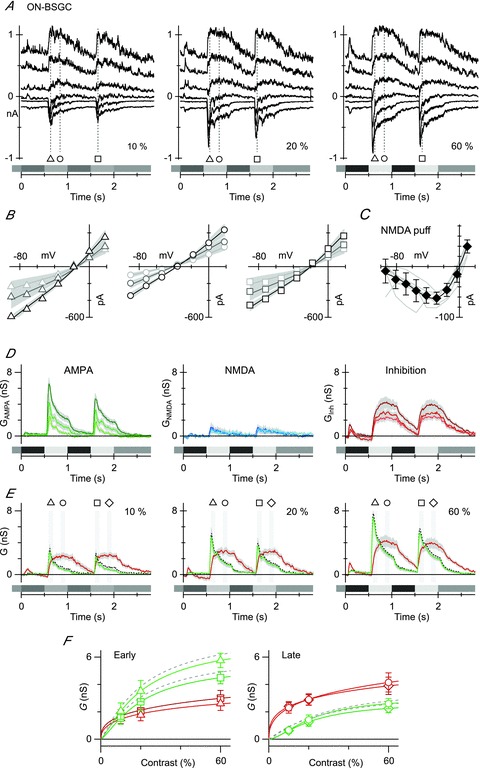
Figure 5. Contrast dependence of light-evoked synaptic inputs to ON BSGCs.

A, currents recorded from an ON BSGC held at six potentials at 25 mV intervals between –98 and +27 mV. The stimulus was a 125 μm-diameter spot, square-wave modulated at 1 Hz. The contrast is shown at the bottom right of each panel. Markers show the time points for the I–V relations shown in B. B, the symbols show the light-evoked, series resistance-corrected I–V relation averaged from individual I–V relations in nine ON cells. The fits, shown by the continuous lines, represent the average of the fits to the individual cells. The shaded regions show the SEM for the fits across the group of cells. C, leak-subtracted I–V curves of individual responses to pressure ejection of 2 mm NMDA onto seven ON BSGCs (light grey lines). Individual I–V curves have been normalized to the average slope conductance for the dataset calculated for the most positive three data points. The diamonds show the mean ± SD. The continuous line shows the fit to the mean data of the function describing the voltage dependence of NMDA receptor conductance. D, conductance components calculated every 10 ms for the duration of the light stimulus (see Methods). The shaded regions show the SEM. The linear AMPA conductance (GAMPA) is shown in green, the NMDA conductance (GNMDA) is shown in blue and the inhibitory conductance (Gi) is shown in red, here and in all subsequent figures. The darkest lines indicate the highest contrast. E, average conductance components calculated for the same data as D, except green traces represent the total excitatory conductance as determined from a linear fit to the I–V curves. The dashed grey line shows the average excitatory conductance from a sum of the AMPA and NMDA conductances from D. Note that it falls within the SEM (grey shading) of the conductance generated via linear fits. F, the average amplitude of the excitatory and inhibitory conductance components measured as a function of stimulus contrast at the time points shown in E. The smooth lines show empirical fits to the data. At the early time point, inhibition saturated at a lower contrast than excitation and was smaller (left panel), while at the late time point inhibition was larger than excitation, but still saturated at a lower contrast (right panel).
