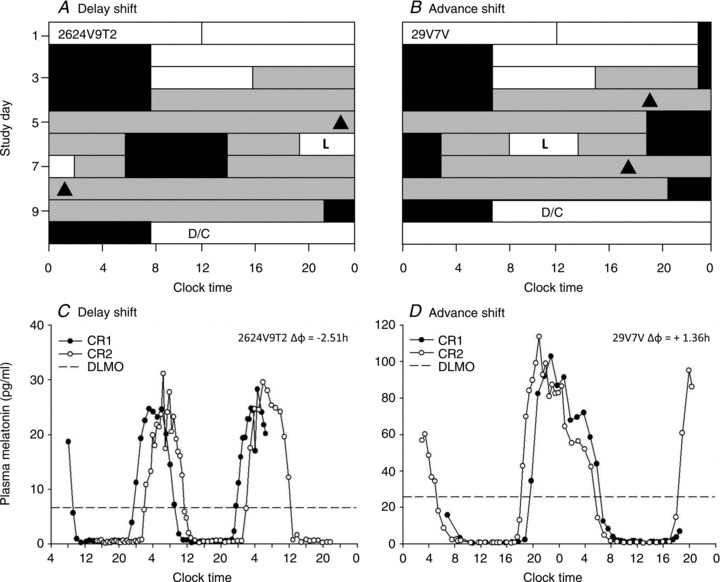
Figure 1. Study protocol.

Example of a raster plot for a phase delay protocol (A) and a phase advance protocol (B). The y-axis depicts consecutive study days and the x-axis clock time. White and grey bars indicate wake episodes in ambient light of <150 lux or <3 lux, respectively; black bars indicate scheduled sleep in 0 lux. ‘L’ indicates the 6.5 h light exposure and the black triangles show the timing of dim light melatonin onset (DLMO) before and after the light exposure. C and D show the corresponding plasma melatonin profiles during constant routines (CR) for the subjects plotted in A and B, respectively. The dashed line indicates the 25% value of the fitted peak-to-trough-amplitude DLMO.
