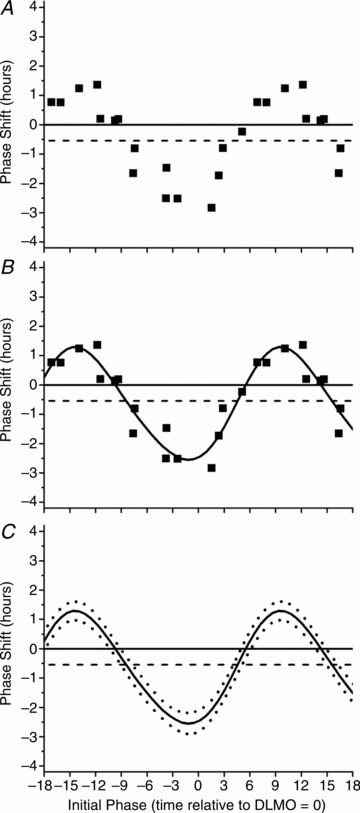
Figure 2. Phase response curve to 6.5 h of 480 nm light.

Raw phase shifts in plasma melatonin DLMO are plotted as a function of circadian phase (A). Circadian phase was computed as the time at which light onset occurred relative to the DLMO estimate from CR1. Per convention phase delays are negative on the y-axis and phase advances are positive. Circadian phase 0 on the abscissa refers to light onset coinciding with DLMO on CR1 with a negative value indicating that the light onset was timed prior to CR1 DLMO and a positive value indicating that light onset occurred after CR1 DLMO. Phase shifts were fitted with a two-harmonic function (continuous line, B). According to the 95% confidence intervals generated from the fit two-harmonic function (dotted lines, C), phase shifts were significantly different from 0 at all phases (continuous horizontal line, A–C) with no evidence of a dead zone. The estimated drift due to intrinsic circadian period is illustrated by the dashed line (−0.54 h over 3 cycles; Czeisler et al. 1999).
