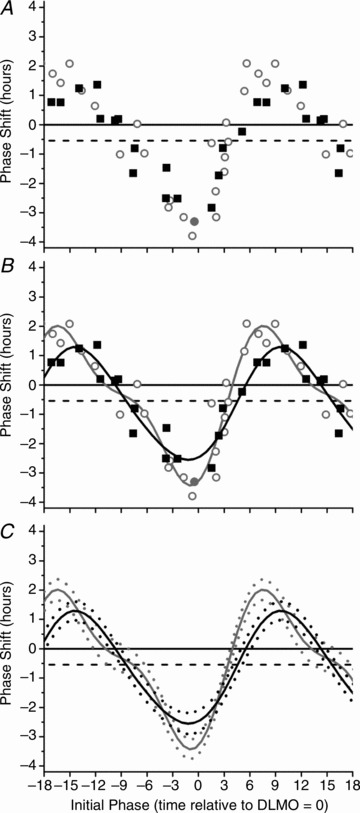
Figure 3. Comparison of phase response curve to 6.5 h of 480 nm light and 6.7 h of 10,000 lux white light.

The phase response curve to 6.5 h of 480 nm light and 6.7 h of 10,000 lux white light for phase shifts calculated over three circadian cycles using the DLMO estimate from CR1. The raw data (A) and two-harmonic fits (B) for both the monochromatic 480 nm light (black squares, black line) and 6.7 h polychromatic white light (open grey circles, grey line) PRCs are shown. The 95% confidence intervals generated from the fit two-harmonic functions (monochromatic blue, dashed black line; polychromatic white, dashed grey line, C) show that the two PRCs are not significantly different except for a small window around the maximal delay and advance region. Phase shifts were computed using either plasma (open symbols) or salivary (filled symbols) melatonin for the 6.7 h polychromatic white PRC. The plotting convention is described in the legend for Fig. 2.
