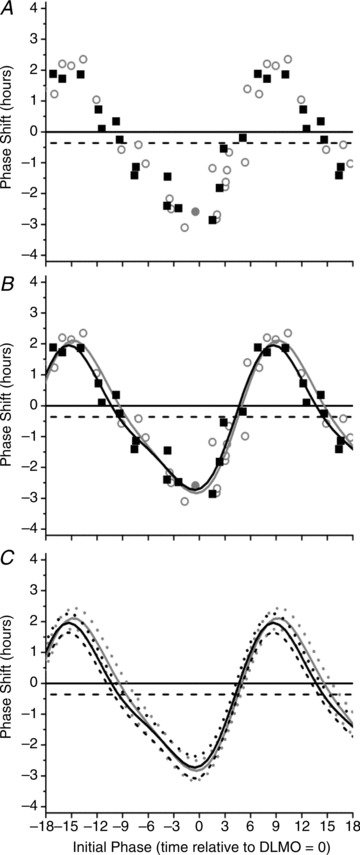
Figure 4. Comparison of phase response curve to 6.5 h of 480 nm light and 6.7 h of 10,000 lux white light.

The phase response curve to 6.5 h of 480 nm light and 6.7 h of 10,000 lux white light for phase shifts calculated over two circadian cycles. The raw data (A) and two-harmonic fits (B) for both the monochromatic blue light (black squares) and 6.7 h polychromatic white light (open grey circles) PRCs are shown. Both PRCs were fitted with a two-harmonic function (monochromatic blue, continuous black line; polychromatic white, continuous grey line, B). Due to insufficient data to estimate DLMO, one subject was removed from the 6.7 h PRC for this analysis. The 95% confidence intervals generated from the fitted two-harmonic functions (monochromatic blue, dashed black line; polychromatic white, dashed grey line, C) show that the two PRCs are not significantly different. The plotting convention is described in the legend for Fig. 2.
