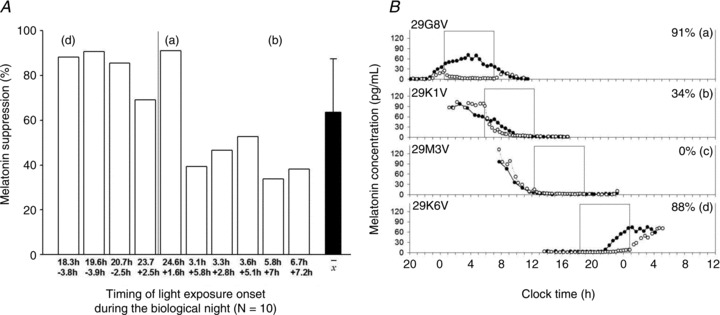
Figure 5. Melatonin suppression throughout the biological night in order of timing of light exposure.

A shows individual and average percentage melatonin suppression during the 6.5 h of blue light ordered by the timing of the light exposure in relation to the timing of CR1 DLMO (numbers in the upper row represent the timing of LE, the lower numbers represent the timing of CR1 DLMO in decimal hours). Melatonin suppression is expressed as the area under the curve (AUC) during the light exposure expressed as the difference from the AUC during CR1 for the corresponding clock times for individuals (open bars; N = 10) and as a group (filled bar: mean ± SD). The vertical line indicates light exposures starting after midnight. B depicts four individual melatonin profiles approximately 90 deg (∼6 h) apart during CR (filled symbols) and light exposure (open symbols). The open box indicates the timing of the 6.5 h light exposure. In B, a, b and d correspond to the same individual indicated in A.
