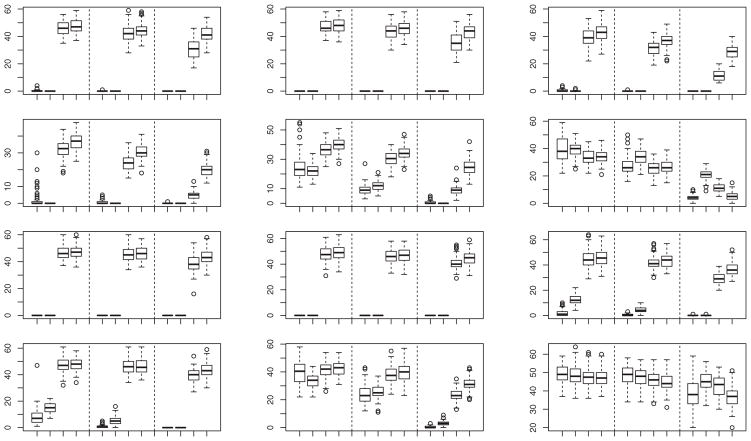
Figure 4.
Boxplots of percentage of misclassified observations calculated from 100 simulated samples from models (c) (rows 1 and 2) and (d) (rows 3 and 4) when θR = (ρR, ℓR), with ρR = 0.85 and 0.5 in rows 1, 3 and 2, 4, respectively; and ℓR = 3, 2, and 1 in columns 1, 2, and 3, respectively. In each group of 12 boxes, the first four are for n1 = n2 = 10 and k = 2, the next four are for n1 = n2 = 25 and k
 = 2, and the last four are for n1 = n2 = 25 and k
 = 1. In each group of four boxes, the data are transformed by Q̂−1 (first box), R−1 (second box), or T−1 (third box), or are untransformed (fourth box).

