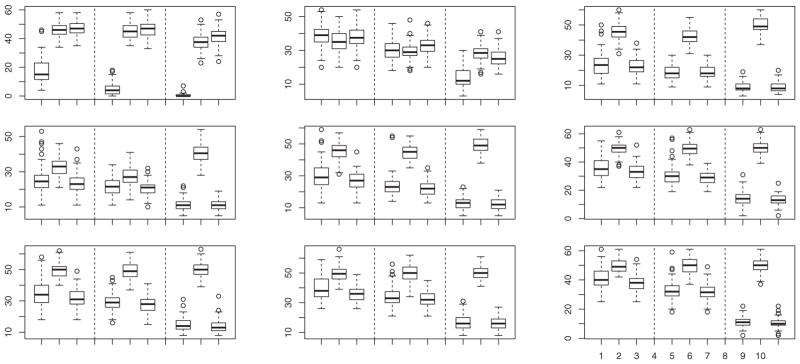
Figure 6.

Boxplots of percentage of misclassified observations calculated from 100 simulated samples from model (a) when θR = (ρR,r, ℓR), with ρR,r = ρR + 0.1 cos(r/2); ρR = 0.75, 0.5, and 0.25 in rows 1, 2, and 3, respectively; and ℓR = 3, 2, and 1 in columns 1, 2, and 3, respectively. In each group of nine boxes, the first three are for n1 = n2 = 10 and k = 2, the next three are for n1 = n2 = 25 and k
 2, and the last three are for n1 = n2 = 25 and k
 = 1. In each group of three boxes, the data are transformed by Q̂−1 (first box) or T−1 (second box), or are untransformed (third box).
