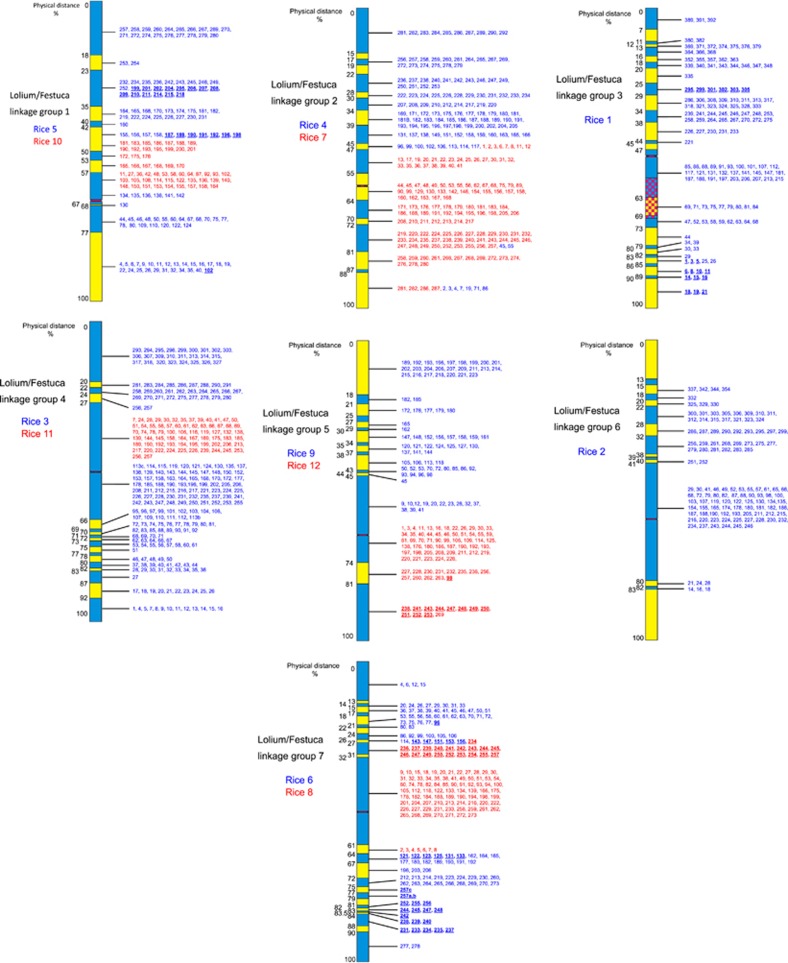
Figure 1.
Introgression maps of L. perenne/F. pratensis linkage groups 1–7. Physical distances are shown on the left. Alternating blue and yellow colours are used to show the points of recombination between Lolium and Festuca delineating the physical bins. Centromeres are drawn in red. Bin allocation of rice BPs is shown on the right of each diagram (GenBank accession numbers for each clone can be found in Supplementary Data). Where two rice PMs map to one Lolium/Festuca linkage group the BPs from the different rice groups are shown in red or blue. BPs in bold and underlined map out of order as compared with rice. The chequered area on linkage group 3 represents the NOR (King et al., 2002a).

