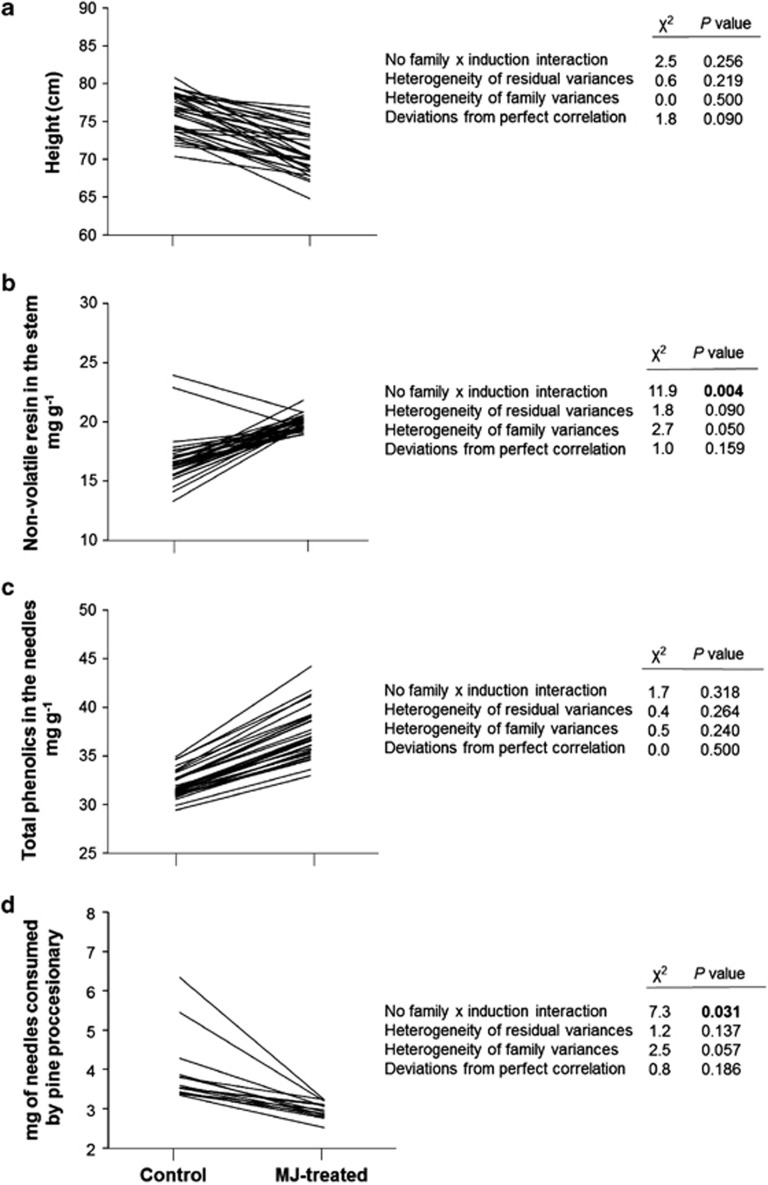
Figure 1.
Norms of reaction for (a) height, (b) concentration of stem non-volatile resin, (c) concentration of needle total phenolics and (d) milligrams of needles consumed by T. pityocampa larvae in the in vitro feeding trial. Each line represents the mean response (n=4 replicates) of a single pine half-sib family in the control versus MJ-treated conditions. Likelihood ratios and P-values for testing different hypotheses on the relevance and interpretation of the genotype by treatment interaction are also shown (see details in Supplementary Table S1 of Supplementary Materials). Significant P-values (P<0.05) are typed in bold.

