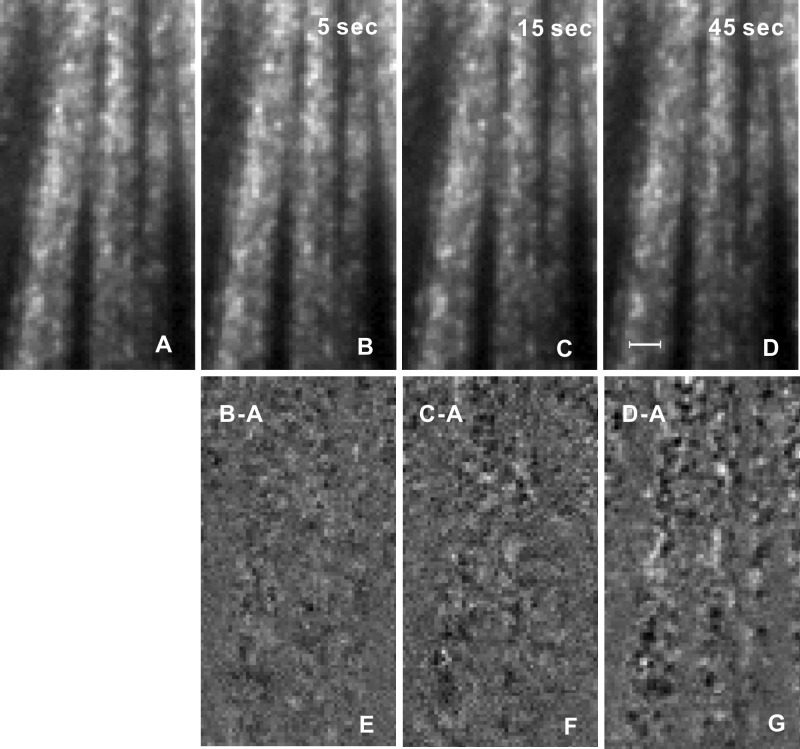
Figure 2.
Temporal change of speckled texture. (A–D) Reflectance images taken at 660 nm with different imaging intervals. (E–G) Difference in images between (B) to (D) and (A). Bundle boundaries become more apparent with increase of imaging interval. Scale bar: 20 μm. The gray scales of (A) to (D) and (E) to (G) are the same.

