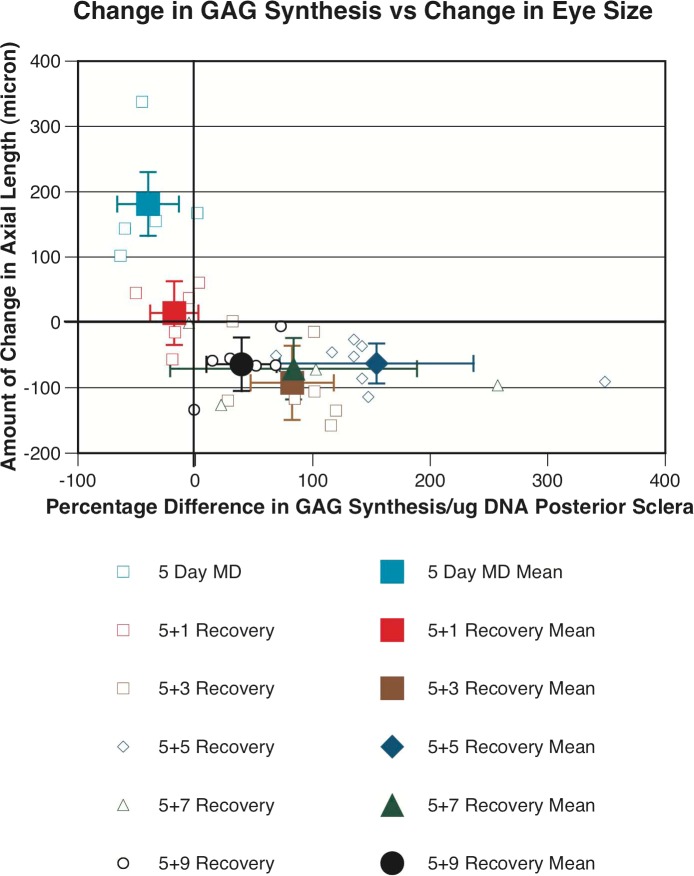
Figure 7.
Change in axial length in the treated eyes of tree shrew (y-axis) plotted against the percentage difference in glycosaminoglycan synthesis in the posterior sclera between treated and control eyes (x-axis) in tree shrews. Small and open symbols represent individual eyes, and large and solid symbols represent averages for each group (mean ± SD). It is clear that most of the recovery eyes that shortened axially (27 of 30—below zero on the y-axis) had an increase in glycosaminoglycan synthesis in the posterior sclera compared to their fellow eyes, whereas tree shrew eyes that elongated due to deprivation-induced myopia (above zero on the y-axis) underwent a decrease in glycosaminoglycan synthesis in the posterior sclera, when compared to their fellow eyes.

