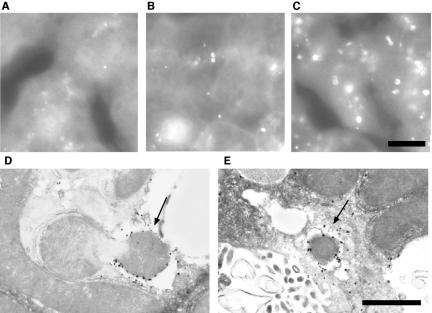
Figure 3.
Liver autophagy in response to starvation. (A–C) Liver samples were prepared from GFP-LC3 transgenic mice before (A) or after 24-h starvation (B and C) and fixed with 4% paraformaldehyde. Cryosections were analyzed by fluorescence microscopy. Panel C demonstrates the most highly induced case. Bar, 10 μm. (D and E) Localization of GFP-LC3 in hepatocytes from 24-h starved GFP-LC3 mice. Liver samples were prepared from GFP-LC3 transgenic mice after 24-h starvation and fixed with 4% paraformaldehyde. The localization of GFP-LC3 was examined by silver-enhanced immunogold electron microscopy using an anti-GFP antibody. A cup-shaped isolation membrane (arrow in D) and double-membrane autophagosome (arrow in E) were shown. Bar, 1 μm.

