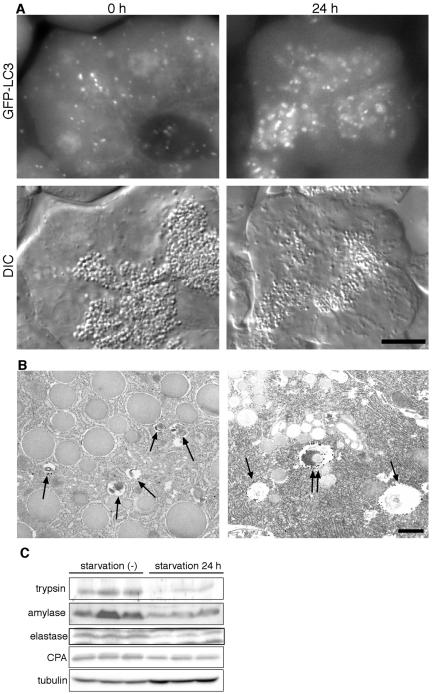
Figure 5.
Autophagy in pancreatic exocrine cells. (A) GFP images (top panels) and corresponding differential interference contrast (DIC) images (bottom panels) at the indicated starvation periods are shown. Bars, 10 μm. (B) Immunoelectron microscopic analysis of pancreatic acinar cells. Before starvation, large zymogen granules and small autophagic vacuoles (arrows) are observed (left panel). After 24-h starvation, the size of autophagosomes is enlarged, and some zymogen granules are observed in the autophagosomes (double arrows; right panel). Bar, 1 μm. (C) Amounts of pancreatic proteases decrease during starvation. Homogenates were prepared from three independent mice before and after 24-h starvation and subjected to immunoblot analysis using antitrypsin, antiamylase, antielastase, and anticarboxypeptidase antibodies. Anti-tubulin antibody was used as a control.

