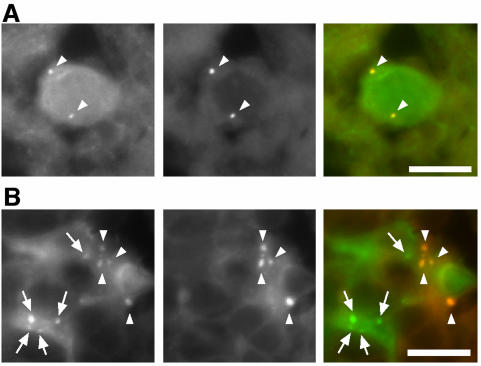
Figure 9.
Distinction between GFP-LC3 and autofluorescence signals. Samples from the frontal cortex of the brain (A) and the medulla of the thymus (B) were analyzed for green (left panels) and red (middle panels) fluorescence. Merged images are shown in the right panels. GFP-specific signals (arrows) and autofluorescent signals (arrowheads) are indicated. A neuron-like cell (A) and stromal cells show autofluorescence. Similar autofluorescent signals were also observed in samples from nontransgenic mice. Bar, 10 μm.

