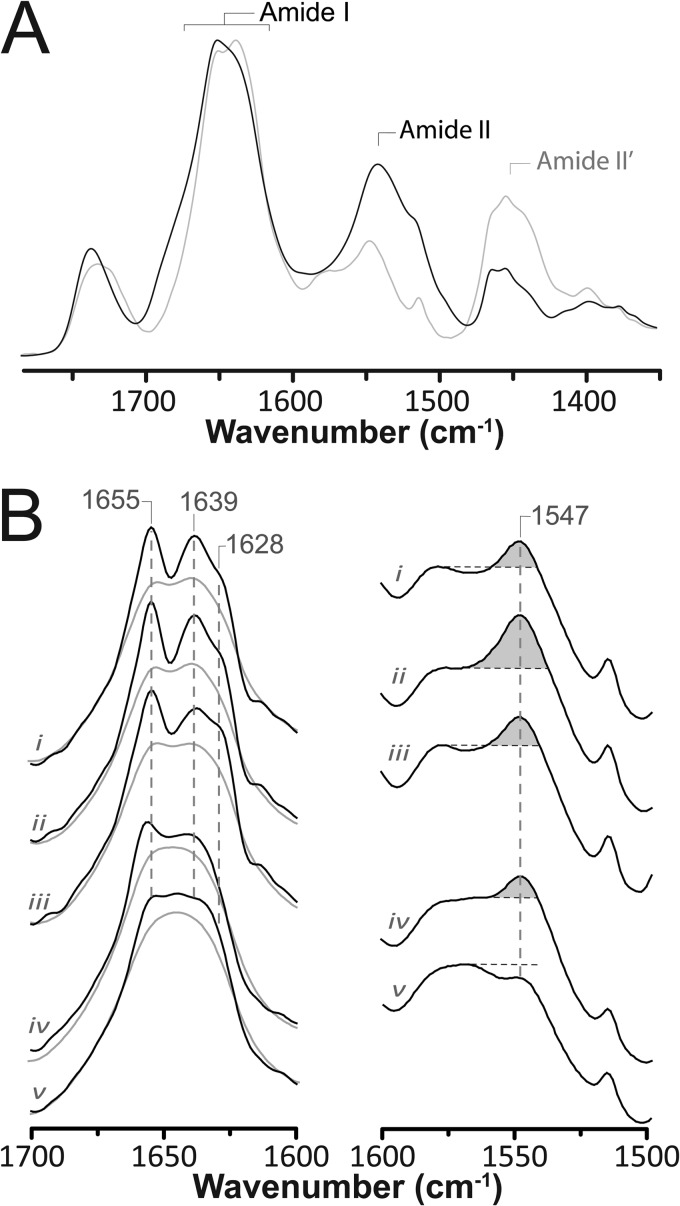
FIGURE 2.
Structural comparisons of membrane-reconstituted GLIC and the nAChR as probed by infrared spectroscopy. A, infrared spectra of aso-GLIC recorded after gentle drying from 1H2O buffer (solid black line) and immediately after addition of 2H2O (dashed gray line). Note the immediate changes in amide I band shape (1700–1600 cm−1) and the immediate decrease in amide II band intensity (1547 cm−1), both indicative of the rapid peptide N-1H/N-2H exchange of solvent-exposed peptide hydrogens. Similar spectral effects are observed for other Cys-loop receptors (supplemental Fig. S2). B, infrared spectra recorded after 72 h of equilibration in 2H2O at 4 °C from aso-GLIC (spectrum i), EcoLip-GLIC (spectrum ii), PC-GLIC (spectrum iii), aso-nAChR (spectrum iv), and PC-nAChR (spectrum v). The left column shows the secondary structure-sensitive amide I band both before (gray traces) and after resolution enhancement (black traces) (intensity scaling arbitrary). The right column shows the amide II band in each spectrum. The relative intensity of the amide II vibration is best assessed relative to the intensity of the adjacent broad peak between 1560 and 1600 cm−1, because of aspartic and glutamic acid residues. All of the presented spectra are the averages of several spectra recorded from at least two different purification/reconstitutions.

