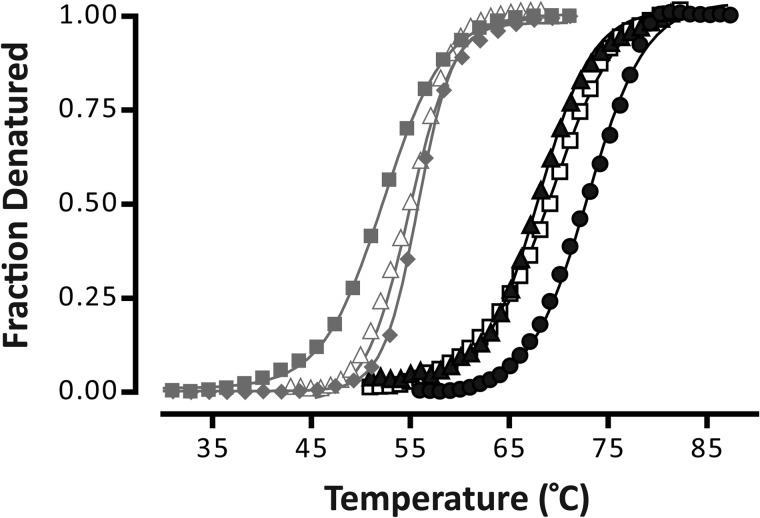
FIGURE 3.
Representative thermal denaturation curves for GLIC (black lines) and the nAChR (gray lines) in different membranes. The denaturation curves are for aso-GLIC (▴), EcoLip-GLIC (●), PC-GLIC (□), aso-nAChR (▵), PC/PA/Chol-nAChR (♦), and PC-nAChR (■). Each curve was fit with a Boltzmann sigmoid from which Td and Boltzmann slope were calculated using GraphPad Prism software (Table 1) (see supplemental materials and Ref. 11). The Boltzmann slope decreases with increasing cooperativity of unfolding.

