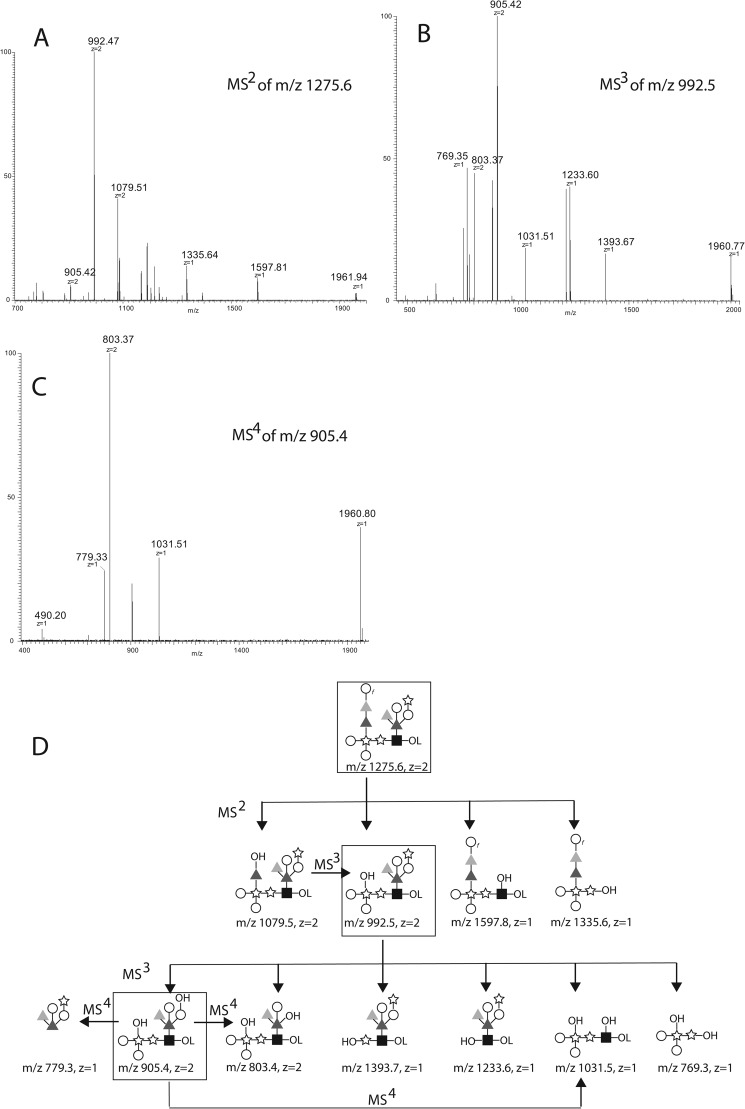
FIGURE 6.
ES-MSn analyses of reduced and permethylated derivatives of the largest glycan released by aq. HF. A, the sample recovered from NMR and reduced with NaBD4 was permethylated and analyzed by positive ion ES-MS on an Orbitrap instrument. The [M+2Na]2+ ion at m/z 1275.6 was isolated and subjected to CID giving rise to the product ion (MS2) spectrum shown. B, the [M+2Na]2+ ion at m/z 992.5 from A was isolated and subjected to CID giving rise to the product ion (MS3) spectrum shown. C, the [M+2Na]2+ ion at m/z 905.4 from B was isolated and subjected to CID giving rise to the product ion (MS4) spectrum shown. D, the proposed fragmentation pathways corresponding to the ions observed in A–C. Unless otherwise noted, z = 2 ions are [M+2Na]2+ and z = 1 ions are [M+Na]+. The symbols are as defined in the legend to Fig. 4.

