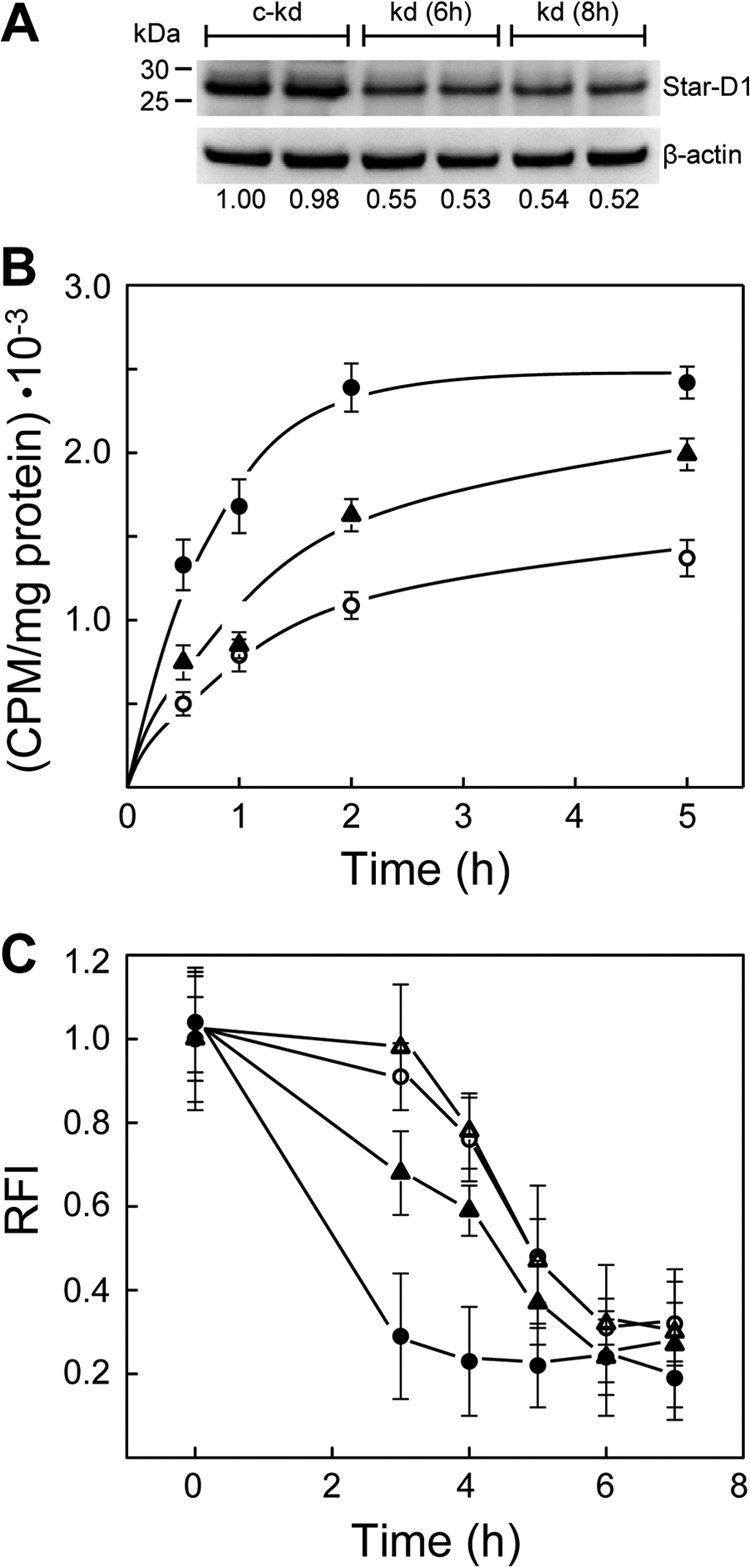
FIGURE 4.

Effect of StarD1 knockdown on mitochondrial uptake of 7α-OOH and on peroxide-induced ΔΨm decay. A, StarD1 protein levels. MA-10 cells were treated with StarD1 siRNA for 6 and 8 h, or a control construct for 8 h, allowed to recover for 36 h, and then stimulated with 1 mm Bt2cAMP for 3 h. Immediately thereafter, cells were lysed and analyzed for StarD1 by immunoblotting. Duplicate samples of 40 μg of total protein per lane are represented: kd, knockdown; c-kd, control knockdown. Numbers below lanes indicate normalized StarD1 band intensities relative to β-actin. B, 7α-OOH uptake. A 6-h exposure to control or active siRNA was used followed by 36 h of recovery. Bt2cAMP (1 mm, 3 h)-stimulated knockdown and control knockdown cells, along with nonstimulated control knockdown cells, were incubated in the presence of SUV-borne [14C]7α-OOH (50 μm, ∼150 nCi/μmol) in DME medium at 37 °C. At the indicated times, cells were washed and homogenized, and the Mito fraction was isolated by differential centrifugation. Lipid extracts were prepared and analyzed by scintillation counting. Protein-based specific radioactivity of the lipid extracts is plotted as a function of incubation time. ●, stimulated control knockdown cells; ○, nonstimulated control knockdown cells; ▴, stimulated knockdown cells. Calculated 7α-OOH content at 2 h (nmol/mg of Mito protein) was 0.72 ± 0.05, 0.33 ± 0.02, and 0.48 ± 0.03, respectively. C, effects on ΔΨm. Control and active siRNA treatment conditions were as described in B. Cell stimulation in this experiment was carried out using 150 μm Bt2cAMP, which remained in the system after peroxide was added. Cells were incubated for the indicated times with 100 μm SUV 7α-OOH and then washed and incubated with JC-1 (2.5 μg/ml) for 30 min. After washing, the cells were examined by fluorescence plate reader using 560 nm excitation/595 nm emission and 485 nm excitation/535 nm emission. Time-dependent changes in 595 nm/535 nm fluorescence intensity ratio (RFI) are plotted. Cells were as follows: ●,▴, stimulated; ○,▵, nonstimulated; ▴,▵, knockdown; ●,○, control knockdown. Means ± S.E. of values from 3–4 replicate experiments are plotted in B and C.
