FIGURE 7.
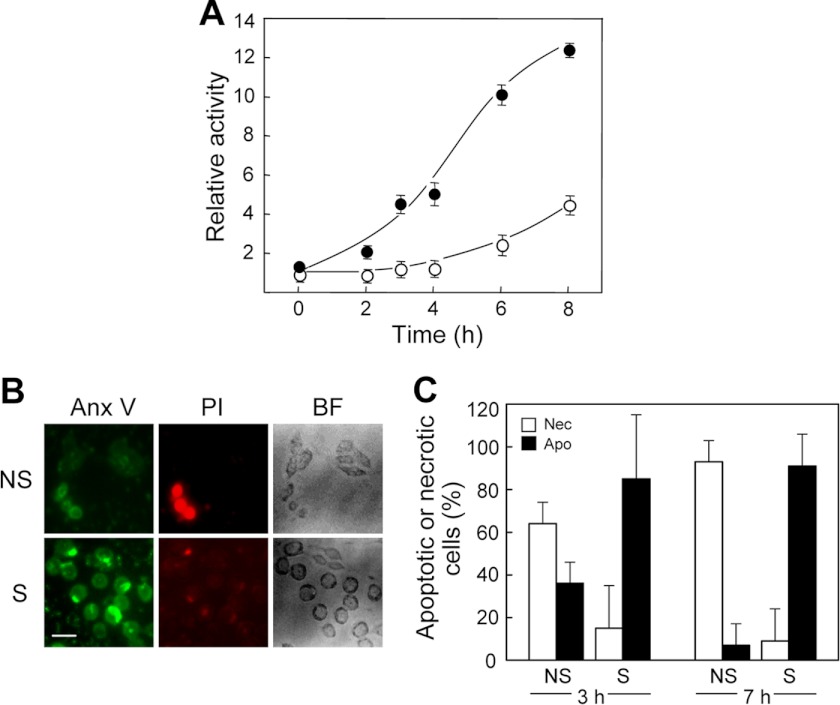
Effect of steroidogenic activation on death mechanism of 7α-OOH-challenged cells. A, caspase-9 activation in 7α-OOH-challenged cells. MA-10 cells that had been stimulated for 3 h with 1 mm Bt2cAMP, along with nonstimulated controls, were incubated with 50 μm SUV-7α-OOH for the indicated times and then recovered by scraping and analyzed for caspase-9 activity using a chemiluminescence assay. ○, nonstimulated; ●, stimulated. Plotted values are means ± S.E. (n = 3). B, fluorescence images (annexin V-FITC (Anx V) and PI) and bright field (BF) images of cells after exposure to 7α-OOH. Nonstimulated (NS) and 1.5-h Bt2cAMP-stimulated (S) cells were incubated with 50 μm SUV-7α-OOH for 7 h. Immediately thereafter, the cells were washed free of SUVs and analyzed for death mode by fluorescence microscopy with annexin V-FITC staining to detect early apoptosis and PI staining to detect necrosis. Bar: 50 μm. C, integrated fluorescence image intensities after 3 and 7 h of cell exposure to 7α-OOH. Plots show percentage of apoptotic (Apo) or necrotic (Nec) cells relative to total dead/dying cells in the nonstimulated (NS) and stimulated (S) populations. Means ± S.E. of values from 3 separate experiments are plotted. *, p < 0.01 versus necrotic; #, p < 0.001 versus apoptotic; †, p < 0.0001 versus necrotic ; §, p < 0.0001 versus apoptotic.

