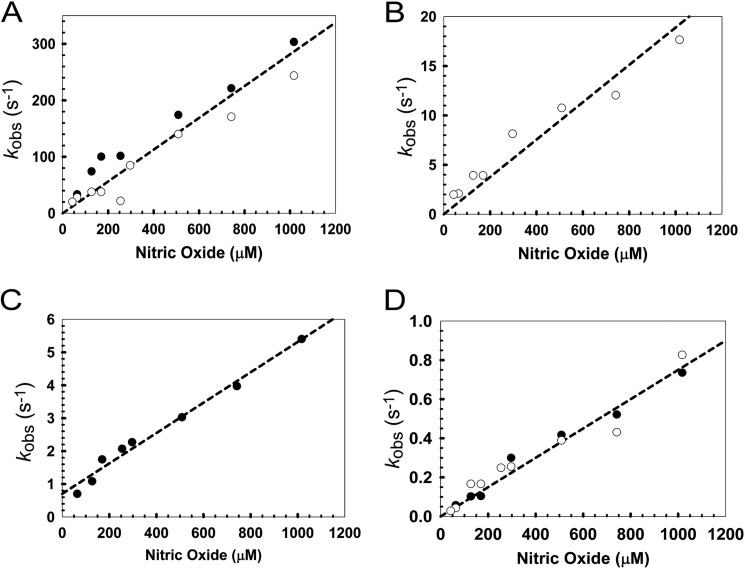
FIGURE 6.
Dependence of the rate of each step of nitrosylation on NO. A–D, plots of the observed (pseudo-first order) rate constants (kobs) from fits of the kinetic data at 360 (white circles) and 420 nm (black circles), over a range of NO concentrations. Note that panels A–D correspond to steps 1–4, respectively (see under “Results”). Least squares linear fits are shown giving apparent second order rate constants (Table 2). The buffer was 25 mm HEPES, 2.5 mm CaCl2, 100 mm NaCl, 100 mm NaNO3, pH 7.5.

