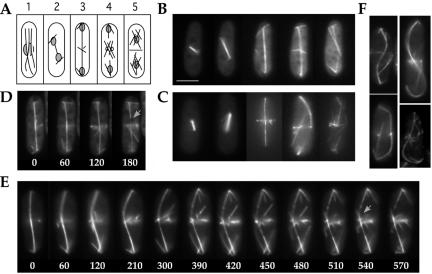
Figure 4.
Delayed mitotic exit in nda3-F200Y mutant cells. (A) Diagram of microtubule arrays during mitotic growth in S. pombe: 1) interphase; 2) anaphase; 3) telophase; 4) formation of postanaphase arrays, spindle breakdown, and mitotic exit; and 5) cytokinesis and G1/S. (B and C) Representative images of mitotic progression for YY105 (B) and nda3-F200Y (AK101) (C) cells. (D) Spindle breakdown in wild-type cells occurs within minutes after maximum spindle extension to cell ends. Time is in seconds. (E) Spindle breakdown during mitotic exit in nda3-F200Y cells is significantly delayed versus wild type. Select images from a single plane time series are shown. Images were acquired at 30-s intervals. Spindle breakdown, indicated by arrows and signified by separation of spindle ends, is seen at 540 s and more clearly at 570 s. Fiduciary marks, due to uneven incorporation of GFP-α2-tubulin, can be seen as early as 210 s, as individual spindle microtubules depolymerize. (F) Four images of contorted telophase spindles in nda3-F200Y cells. Cells with an S-shaped spindle were slightly larger in size and delayed more severely in spindle breakdown. Bar for all images, 5 μm (shown in B).

