
Figure 6.
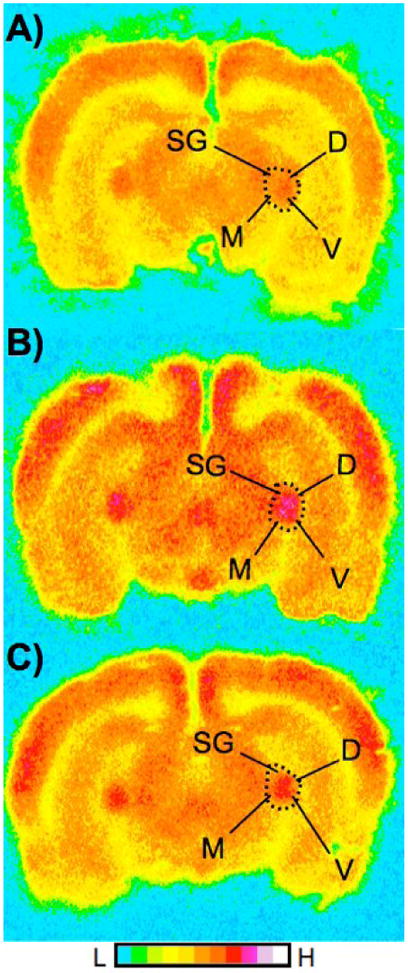
2-DG autoradiographs of the MGN, from three rats, showing relative rates of glucose utilization in pseudocolor (see color scale bar). The left hemisphere is on the left. These coronal sections are approximately −5.60 mm from Bregma (Paxinos & Watson, 1998). Panel A is an unpaired animal, panel B is a delay animal, and panel C is a trace animal. Original autoradiographs are shown as an example of differences in the MGN 2-DG uptake but individual autoradiographs may show variations in optical density of other structures. Abbreviations: SG=suprageniculate; M= medial, D=dorsal, V=ventral, respective areas of MGN.