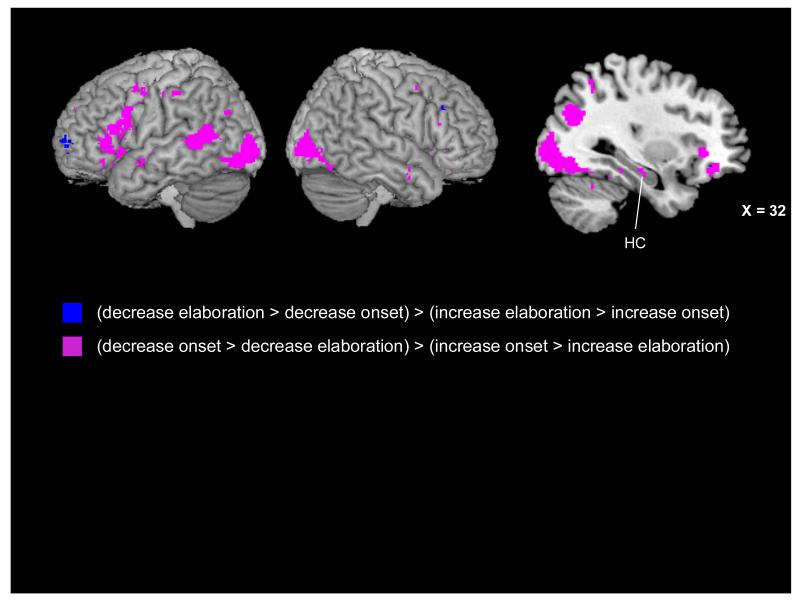
Figure 7.
Neural activity present in the interaction contrasts inclusively masked with the Condition (decrease, increase) × Phase (instruction, onset, elaboration) interaction results. Regions in blue were more active for the decrease condition during the elaboration phase and the increase condition in the memory onset phase. Regions in purple were more active for the decrease condition during the memory onset phase and the increase condition in the elaboration phase, including a region of right hippocampus (Tal: x = 32, y = −18, z = −13) evident on the saggital slice.

