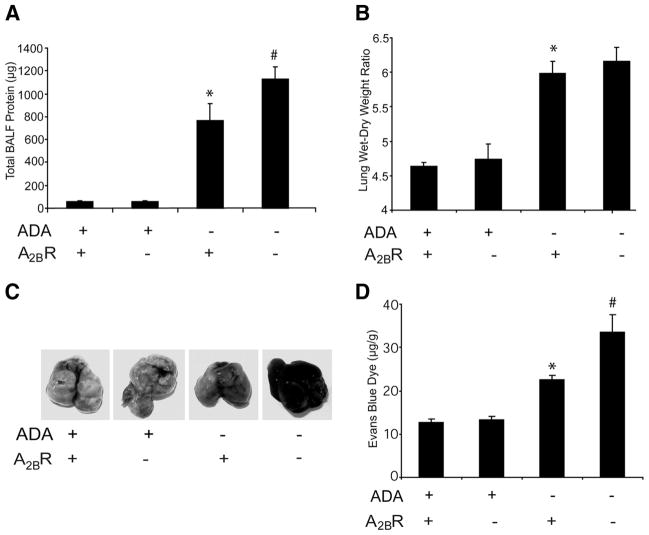
FIGURE 6.
Vascular permeability analysis. A, BAL fluid was collected from postnatal day 35 mice, and total BAL fluid protein levels were determined by Bradford assay. Data are mean total protein content ± SEM. *, p ≤ 0.05 vs ADA+ mice; #, p ≤ 0.05 vs ADA−/− A2BR+/+ mice. n = 6 (ADA+), 8 (ADA−/−). B, Lungs from postnatal day 35 mice were collected, and lung water content was determined by lung wet-dry weight ratio. Data are mean ratios ± SEM. *, p ≤ 0.05 vs ADA+ mice; #, p ≤ 0.05 vs ADA−/− A2BR+/+ mice. n = 4 (ADA+ A2BR+/+ and ADA+A2BR−/−), n = 6 (ADA−/−A2BR+/+ and ADA−/−A2BR−/−). Mice were given i.p. Evans blue dye (0.2 ml of 0.5% in PBS) and sacrificed 4 h later, and the hearts and lungs were harvested. C, Representative images of lungs. Evans blue dye concentrations were quantified in lung (D). Data are mean dye content in micrograms per gram of lung tissue ± SEM. *, p ≤ 0.05 vs ADA+ mice; #, p ≤ 0.05 vs ADA−/− A2BR+/+ mice. n = 4 (ADA+ A2BR+/+ and ADA+ A2BR−/−), n = 8 (ADA−/− A2BR+/+ and ADA−/−A2BR−/−).

