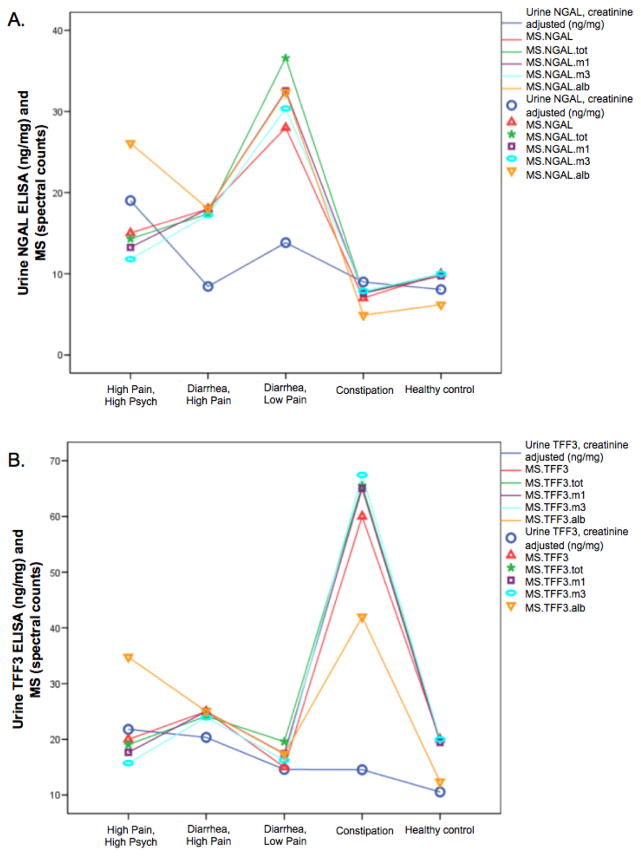
Figure 3. NGAL and TFF3 expression in IBS symptom subgroups by MS and ELISA.
A) NGAL expression. Blue circle and line is the creatinine adjusted urinary NGAL expression level determined by the ELISA. All the others show the MS data with different normalizations. MS.NGAL - no normalization; NGAL.tot - normalized by the sum of all MS spectral counts for all proteins; NGAL.m1 - normalized by the sum of all proteins except uromodulin (the highest MS spectral counts); NGAL.m3 - normalized by the sum of all proteins except uromodulin, AMBP, albumin (the highest three); NGAL.alb - normalized by the spectral count for albumin. B) TFF3 expression.

