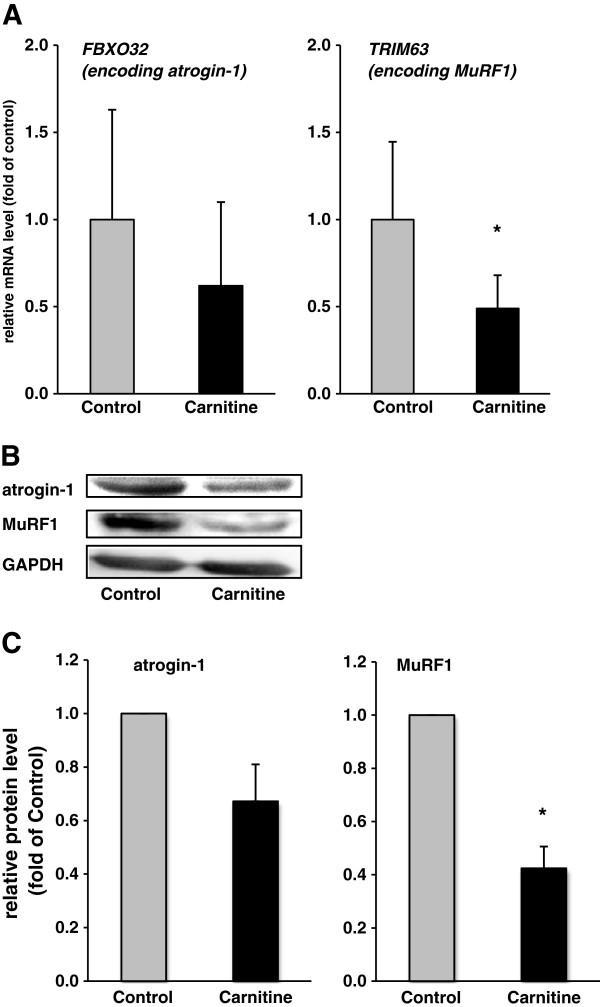
Figure 1.
Relative mRNA abundance of FBXO32 and TRIM63 (A) and relative protein concentrations of atrogin-1 and MuRF1 (B,C) in M. quadriceps femoris of rats fed either a control diet (0 mg carnitine/kg diet; Control) or a diet supplemented with 1250 mg carnitine/kg diet (Carnitine). (A) Bars are means ± SD (n = 12/group). The normalized expression ratio in the control group is set to 1.0. * indicates a significant difference to the control group (P < 0.05). (B) Representative immunoblots specific to atrogin-1, MuRF1 and GAPDH as internal control are shown for one animal per group; immunoblots for the other animals revealed similar results. (C) Bars represent data from densitometric analysis and represent means ± SD (n = 6/group); bars are expressed relative to the protein level of the control group (= 1.00). * indicates a significant difference to the control group (P < 0.05).

