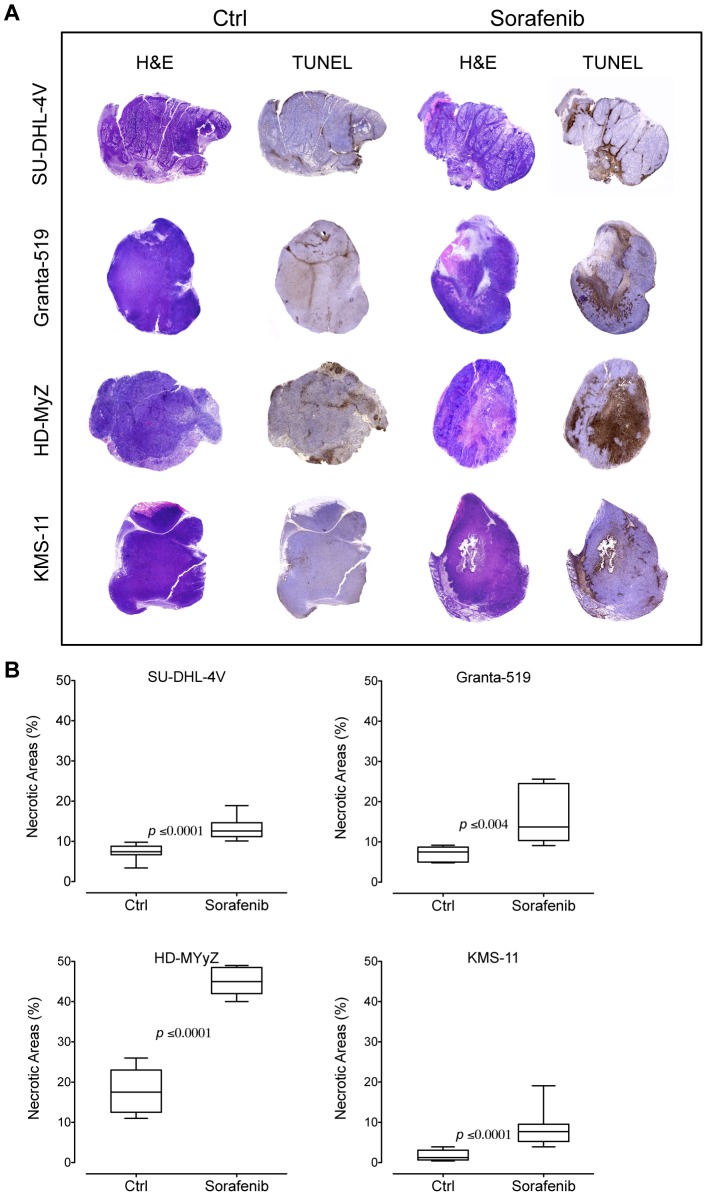
Figure 8. Sorafenib induces in vivo tumor necrosis.
(A) H&E and TUNEL staining of lymphoma tumor treated with sorafenib (90 mg/kg) or control vehicle (DMSO). In the TUNEL-stained section, brown staining represents positive signals within the tumors (blue cells are the negative, living cells). Objective lens, original magnification: 0.08 NA dry objective, 2×. (B) Quantification of necrotic areas on entire tissue sections using ImageJ software. Percentage of necrosis was calculated by the following formula: (necrotic area/total tissue area)×100. The boxes extend from the 25th to the 75th percentiles, the lines indicate the median values, and the whiskers indicate the range of values.

