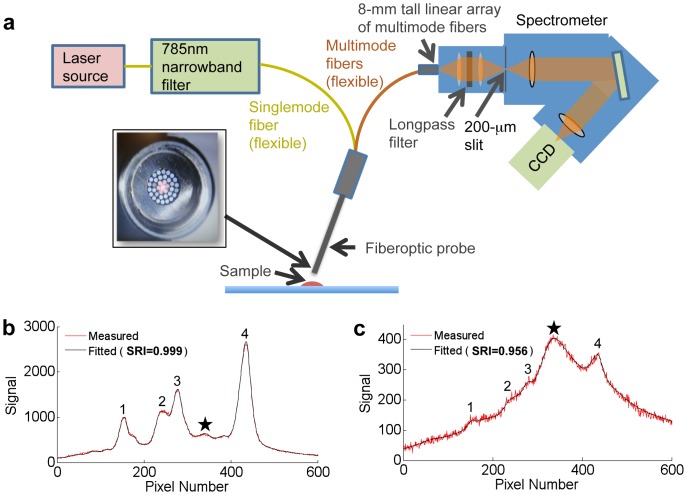
Figure 3. Measurement apparatus.
(a) A spectrometer with CCD detector is used to capture Raman signals from a nanoparticle sample illuminated with a 785-nm laser source. See text for details. (b) Example of a strong signal with a high SRI and (c) a weak signal with a lower SRI, in which noise and broadband background signals increasingly dominate over the SERS signals. Representative SERS peaks are numbered 1–4 and the peak of the broadband background is labeled with a star.

