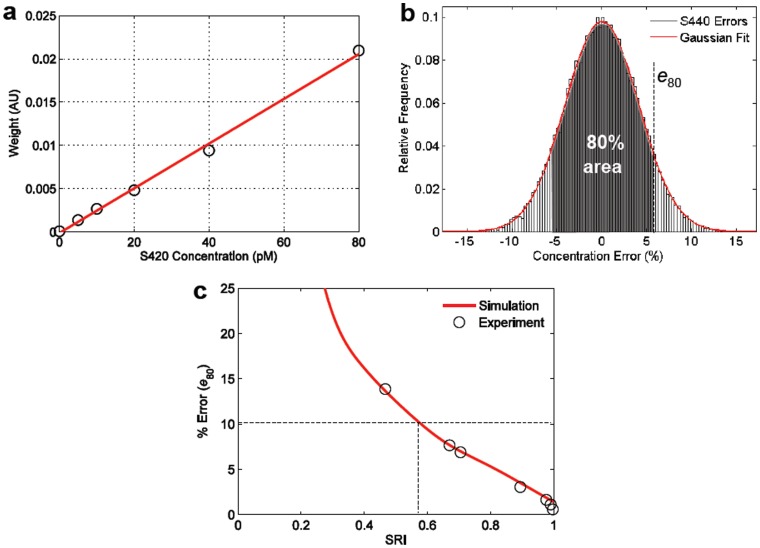
Figure 4. Spectral quality characterization of single-flavor samples.
(a) Weights returned by the least-squares routine are linear over the range of measured concentrations. (b) Errors from multiple measurements of the same single-flavor sample are normally distributed. Shaded region indicates where 80% of the errors lie. (c) A plot of error vs. SRI, in which the reported error is the 80% confidence bound (e 80). The simulations agree well with the results found experimentally.

