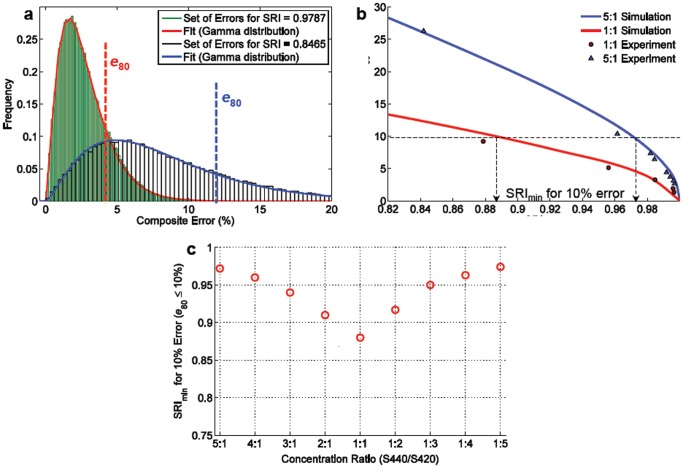
Figure 5. Spectral quality characterization of two-flavor mixtures.
(a) Composite errors for multi-particle mixtures are gamma-distributed. Vertical lines indicate bounds for the 80th percentile of error values (e 80) that may occur for a particular SRI. (b) A plot of error (e 80) vs. SRI for a 1∶1 mixture of particle flavors and a 5∶1 mixture of flavors. Simulations (solid lines) closely predict experimental results. (c) A plot of the minimum SRI required to ensure a composite error ≤10% with 80% confidence. This dual-flavor example shows how the minimum SRI value depends upon the mixture ratio.

