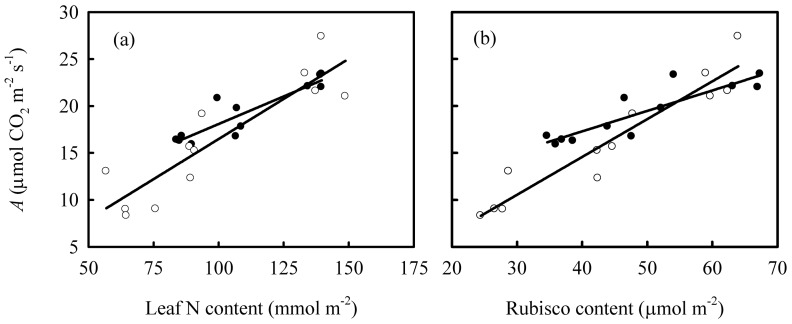
Figure 1. The relationships between leaf photosynthetic rate (A) and (a) leaf N content, and (b) Rubisco content and in Shanyou 63 (closed cycles) and Yangdao 6 (open cycles).
The lines represent the following regression equations: (a) y = 0.12x+6.33 R2 = 0.82 P<0.01 for Shanyou 63; y = 0.17x−0.60 R2 = 0.79 P<0.01 for Yangdao 6; (b) y = 0.22x+8.59R2 = 0.78 P<0.01 for Shanyou 63; y = 0.40x−1.53 R2 = 0.91 P<0.01.

