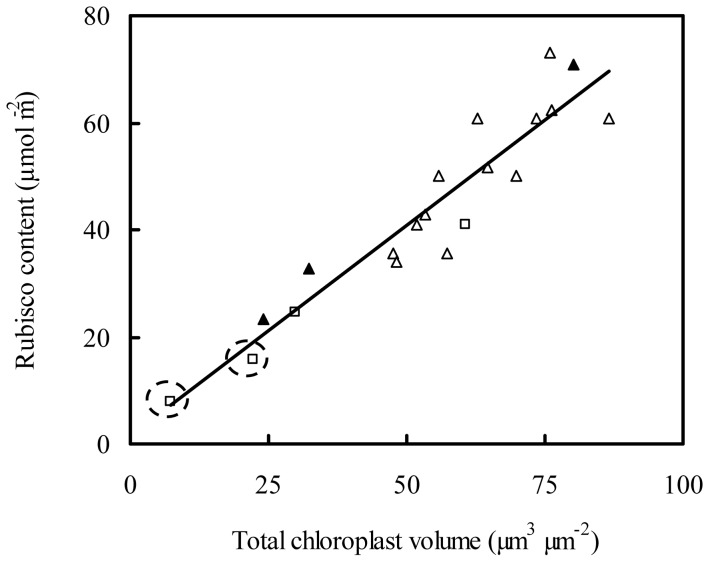
Figure 4. The relationship between Rubisco content and total chloroplast volume per leaf area.
The line represents the regression equation: y = 0.79x+1.36, R2 = 0.88, P<0.01. Data sources: Nicotiana tabacum □ [21]; Chenopodium album ▴ [48]; Aucuba japonica Thunb. △ [24]. The two data points in dotted cycles are from transgenic tobacco with a reduced Rubisco content.

