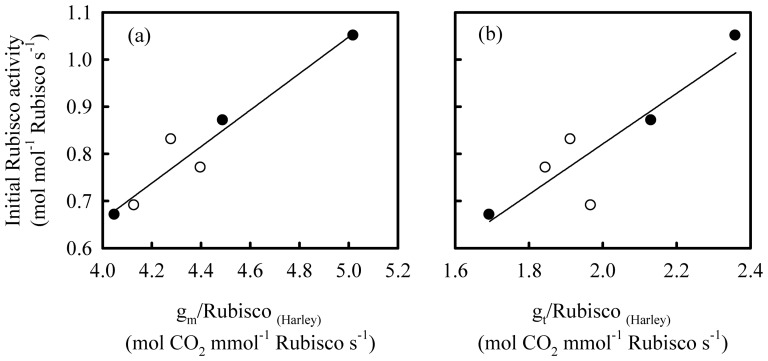
Figure 7. The relationships between initial Rubisco activity and (a) the ratio of mesophyll conductance (gm) to Rubisco content, and (b) the ratio of total conductance (gt) to Rubisco content on Shanyou 63 (solid cycles) and Yangdao 6 (open cycles).
The lines represent the following regressions: (a) y = 0.39x−0.89 R2 = 0.93 P<0.01; (b) y = 0.54x−0.25 R2 = 0.80 P<0.05.

