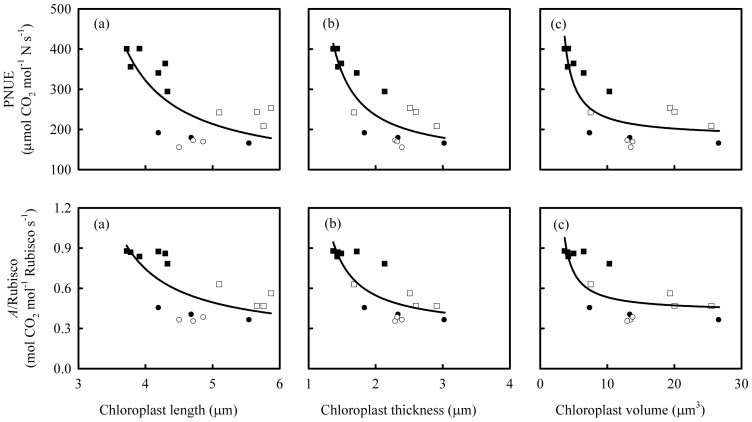
Figure 9. The relationships between chloroplast size and photosynthetic N-use efficiency (PNUE), and the ratio of leaf photosynthetic rate (A) to Rubisco.
The lines represent the following regression equations: (a) y = 91.04x/(x–2.87), R2 = 0.53, P<0.01; (b) y = 121.76x/(x–0.96), R2 = 0.75, P<0.01; (c) y = 180.56x/(x–2.12), R2 = 0.72, P<0.01; (d) y = 0.21x/(x–2.86), R2 = 0.53, P<0.01; (e) y = 0.29x/(x–0.95), R2 = 0.69, P<0.01; (f) y = 0.42x/(x–2.06), R2 = 0.63, P<0.01. Data sources: data of solid squares were collected from Wuyujing 3 (Oryza sativa L. ssp. japonica) with different N supplies; data of open squares were from Shanyou 63 with different N forms and water supply [42]; data of solid and open cycles were from Shanyou 63 and Yangdao 6 with different N supplies.

