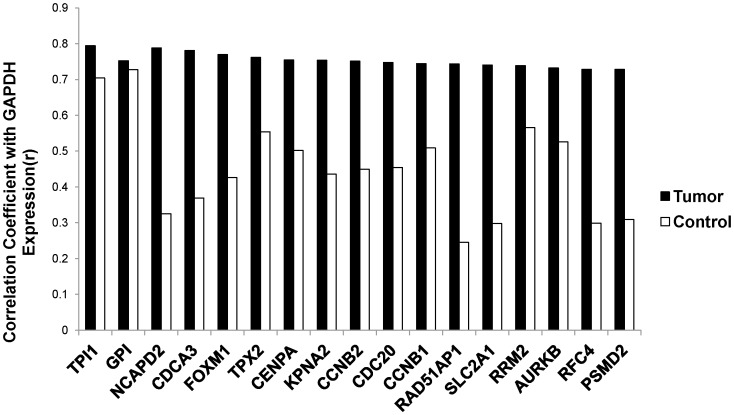
Figure 1. Correlation coefficients for top ranked GAPDH associated gene and GAPDH expression in NSCLCs and controls.
Correlation coefficients of GAPDH expression levels and GAPDH associated gene expression levels were calculated in NSCLCs (black, selected genes with r>0.7) and controls (white) are plotted. TPI1 and GPI are genes encoding two enzymes in glycolysis. The remainder of genes encodes cell cycle related proteins.

