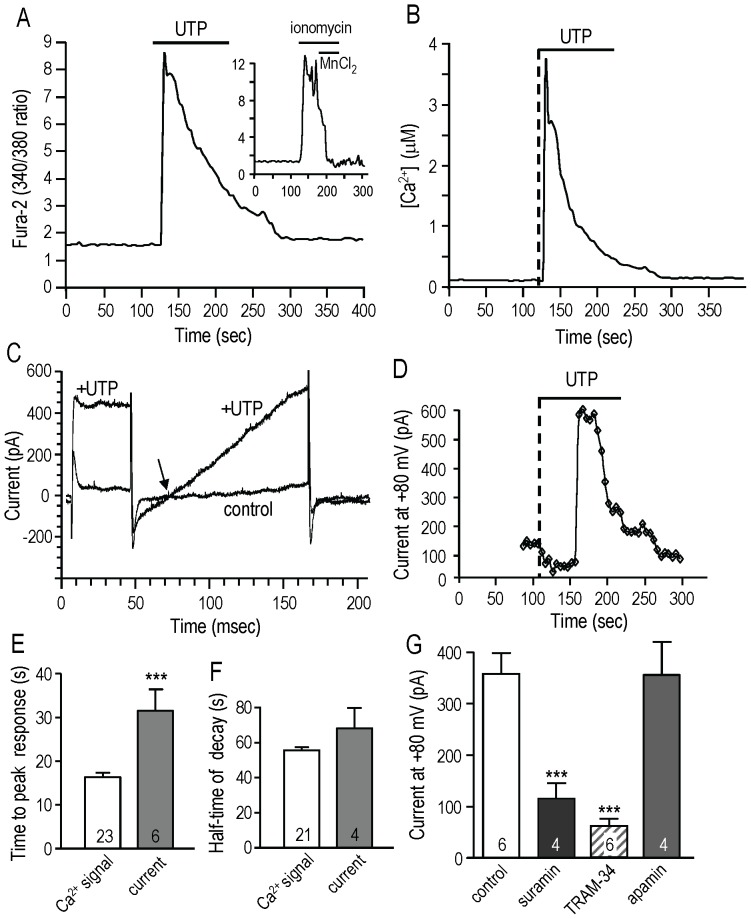
Figure 1. The metabotropic purinergic receptor agonist, UTP, elevates Ca2+ elevation and selectively activates a KCa3.1 current.
A. A representative Fura-2 recording from an MLS-9 cell (rat microglia cell line), in which 100 µM UTP was bath applied during the period marked by the horizontal bar. The inset shows how the Ca2+ signal was calibrated by adding ionomycin and MnCl2, and as described in the Methods. B. The time course of the calibrated UTP-evoked Ca2+ rise (in µM) is shown for the cell in panel A. C. In whole-cell patch-clamp recordings, UTP evoked a large, transient current. From a holding potential of −70 mV, a voltage step to +50 mV was followed by a ramp from −100 to +80 mV applied every 5 sec. The two traces show the baseline control current (standard bath solution) and at the peak after adding 100 µM UTP. The reversal potential is indicated by the arrow. D. The time course of the current measured at +80 mV (same cell as panel C) is plotted on the same time scale as the Ca2+ signal in panel B. Vertical dashed lines indicate the time at which UTP was added. E. Comparison of the mean time to peak response after adding UTP for the Ca2+ signal and current activation. F. Comparison of the time course (half time) of the decay phase of the Ca2+ signal and current. G. UTP selectively activates a KCa3.1 current. The UTP-dependent current was quantified after subtracting the baseline from the maximal current (both at +80 mV) in the absence (control) or presence of the P2Y2 and P2Y6 receptor antagonist, 100 µM suramin. UTP-evoked currents were recorded in separate cells with the selective KCa3.1 blocker (1 µM TRAM-34) or the SK1–SK3 blocker (100 nM apamin) in the bath. The number of cells is indicated on each bar. ***p<0.001

