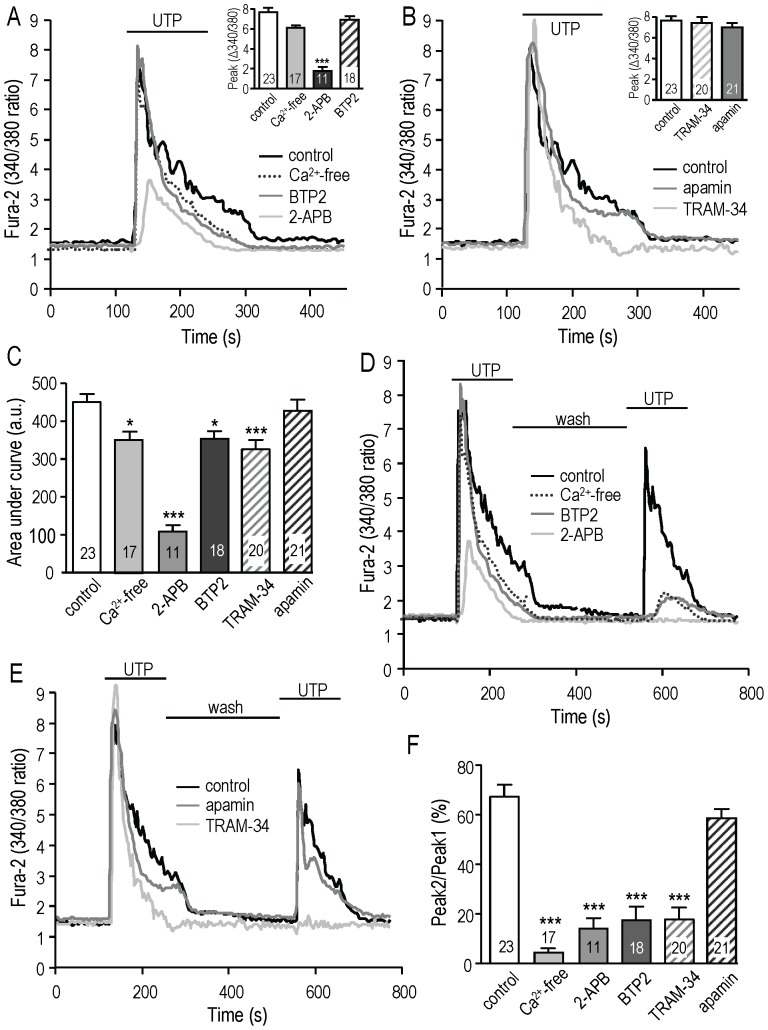
Figure 4. KCa3.1 activation promotes store-operated Ca2+ entry and refilling, and involves CRAC channels.
When used, the Ca2+-free solution or ion channel blocker (50 µM 2-APB, 10 µM BTP2, 1 µM TRAM-34, 100 nM apamin) was present in the bath throughout the recording period. A, B. Representative Fura-2 traces show the UTP-evoked Ca2+ signals from six MLS-9 cells on six separate coverslips. The same control cell is shown in A and B. The insets show the summarized peak responses for the number of cells indicated on each bar. ***p<0.001 C. Summary of the area under the curve (arbitrary units) calculated for the first 4 min of the response (same treatments as in A and B). D, E. Representative Fura-2 traces showing the first and second responses to UTP, with a 5-min recovery period between stimuli. The same control cell is shown in D and E. F. Summary comparing the maximal responses to the first and second UTP stimulus; i.e., Peak 2/Peak 1×100 (same treatments as in D and E). In panels C and F, the number of cells is indicated on each bar, and *p<0.05, **p<0.01, ***p<0.001

