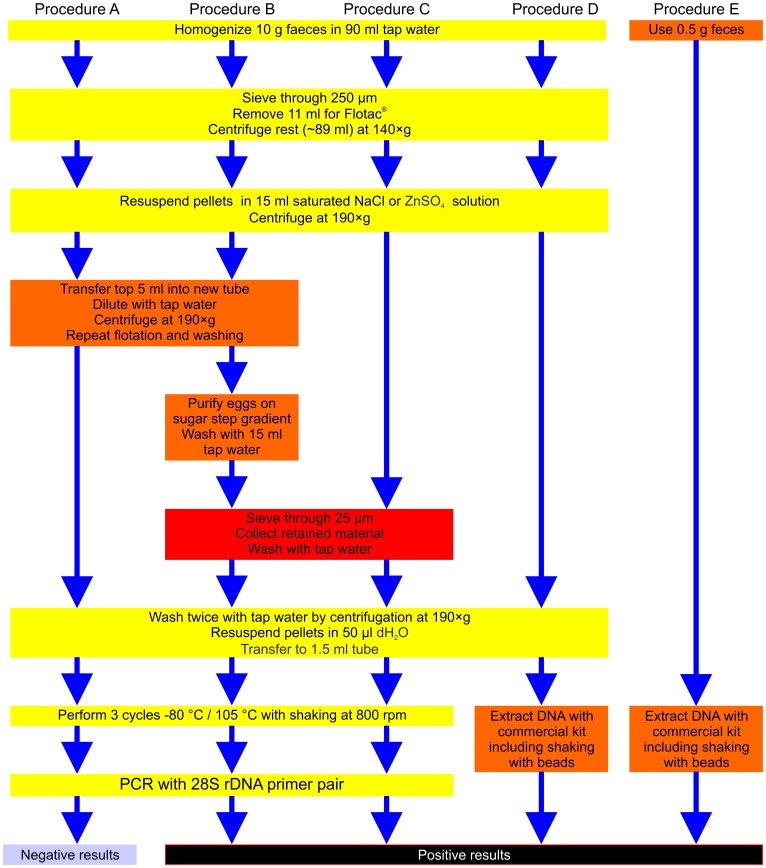
Figure 1. Flow chart comparing different egg purification protocols.
Steps that were used in all protocols are shown in yellow, variant purification protocol steps in either orange or red. The latter color indicates mandatory steps for successful amplification in the final protocol in method C. The fourth protocol was modified from [14] by increasing the amount of feces to 10 g to allow comparison with the other approaches.

