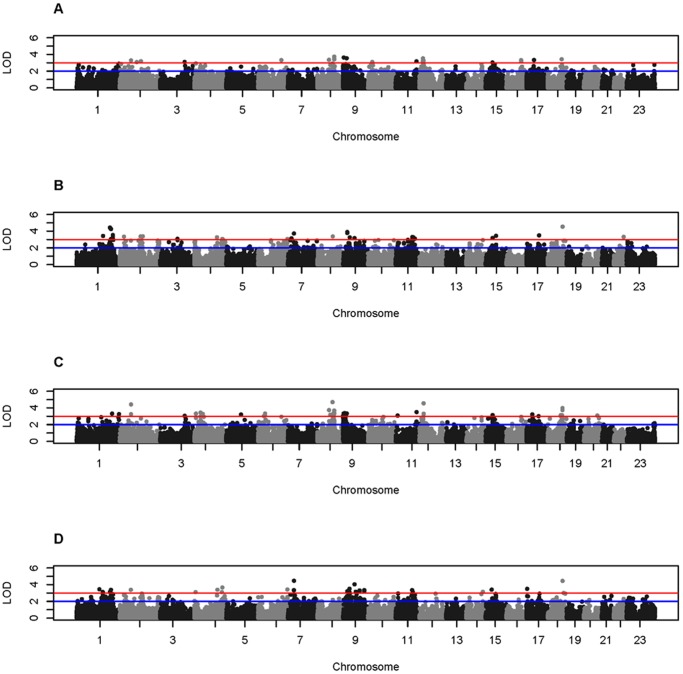
Figure 1. Whole genome two-point LOD scores obtained from stratified analysis.
LOD score thresholds of 2 and 3 are indicated by the blue and red lines, respectively. HLOD scores for CTD-negative (A) and CTD-positive family subsets (B), and LOD scores under an exponential model for CTD-negative (C) and CTD-positive family subsets (D). LOD scores under a linear model are not shown as no two-point LOD scores exceeded 3. Negative two-point LOD scores are set to zero. Manhattan plots were created in R 2.15.0 using modified code obtained from “Getting Genetics Done” (http://gettinggeneticsdone.blogspot.com/).

