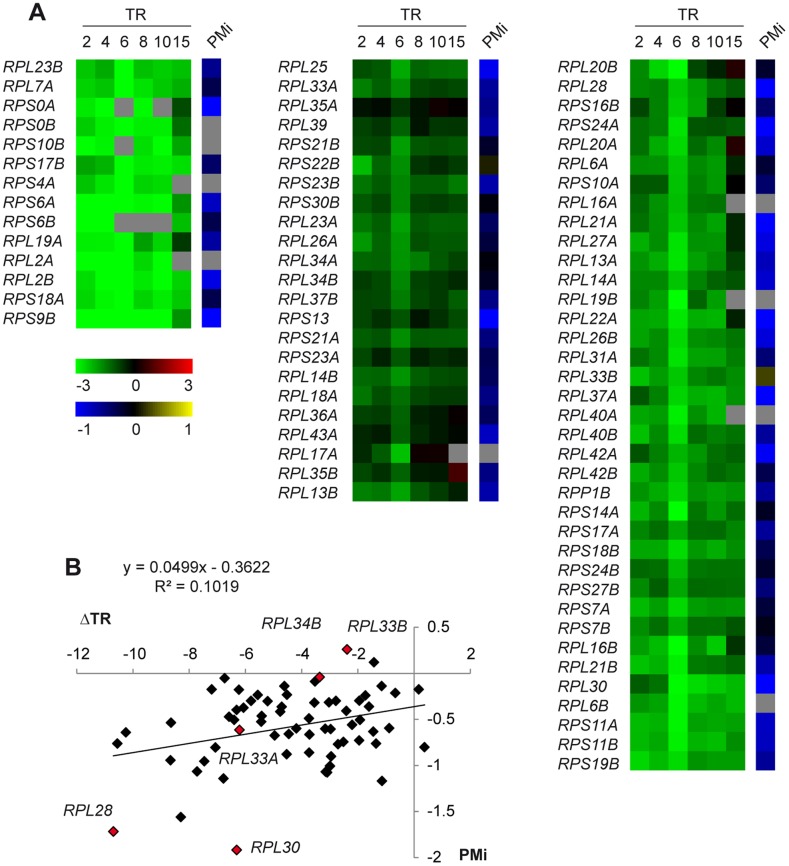
Figure 3. Analysis of the relation between ribosomal protein genes transcription and pre-mRNA processing during osmotic stress.
(A) Clustering RP genes according to their transcription rate (TR) profiles. Wild-type cells were grown in YPD until the exponential phase and were then treated with 0.4 M NaCl. The samples taken at 0, 2, 4, 6, 8, 10 and 15 minutes of osmotic shock were processed to measure the TR of all the yeast genes. The data set series for intron-containing RP genes refers to their respective 0 time on a logarithm scale. A relative repression (stress/non-stress ratio, on the log2 scale) is shown in green (saturated green indicates a decrease of at least 6-fold) and relative induction is depicted red (saturated red indicates an increase of at least 6-fold). RP genes were ordered and grouped into three distinct subclasses by K-means clustering using Euclidean distance. The PMi for all the RP genes are represented in the left panel using a blue-yellow heat map (saturated blue indicates a PMi of ≤−1, while saturated yellow indicates a PMi of ≥1). Grey squares indicate missing values. (B) Comparison of RP genes ΔTR and their PMi in the cells treated with 0.4 M NaCl for 15 minutes related to non-stressed cells. The regression line, equation and correlation coefficient are shown in the graph. The RP genes that have been analyzed by quantitative RT-PCR are indicated as red diamonds.

