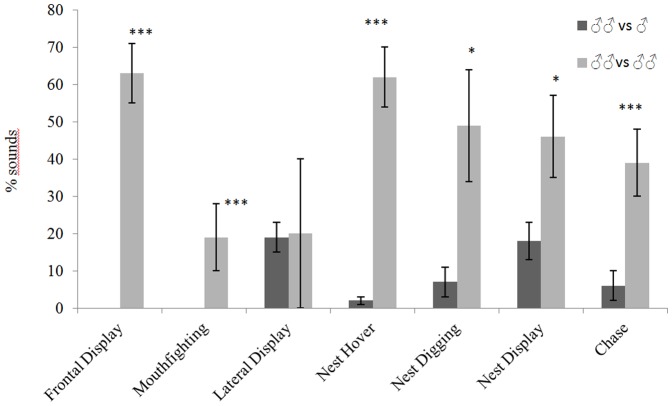
Figure 4. Histogram of the average percentage (mean ± SE) of sound production during the display of different behaviours in Oreochromis niloticus males during different kinds of encounters.
* p<0.05, *** p<0.001: significant differences between light and dark grey bars (Mann-Whithney test). ♂♂ = territorial male; ♂ = intruder male. The statistical test cannot cannot be applied to Frontal display and Mouth fighting because these behaviours were not recorded in ♂♂ vs ♂.

