
Figure 5. Oscillogram (A) and spectrogram (B) of a sound having four pulses in Oreochromis niloticus female.
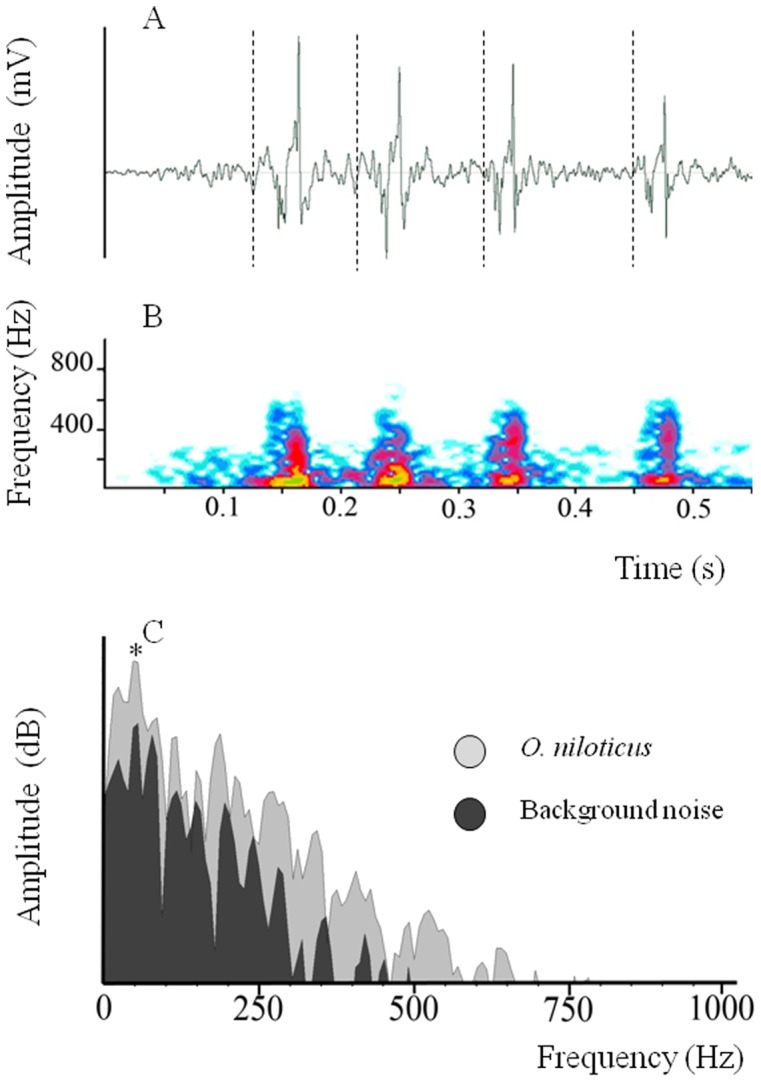
Frequency spectrum of a pulse (C). (*) = Main frequency. Spaces between dotted lines correspond to pulse period.
Official websites use .gov
A
.gov website belongs to an official
government organization in the United States.
Secure .gov websites use HTTPS
A lock (
) or https:// means you've safely
connected to the .gov website. Share sensitive
information only on official, secure websites.
Frequency spectrum of a pulse (C). (*) = Main frequency. Spaces between dotted lines correspond to pulse period.