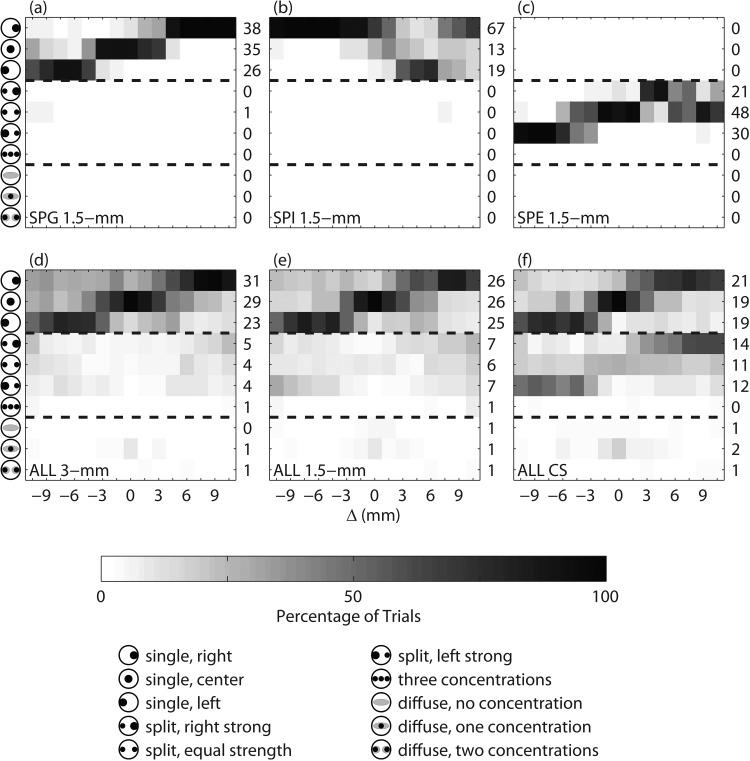
Figure 4.
(Color online) Subjective fusion results as a function of interaural mismatch (Δ). Each row in each panel represents a different categorical perception; the iconic representation of these categories are shown on the left side of the plot. The first three rows represent single image categories. The next four rows represent categories with two or three compact images. The last three rows represent categories with diffuse auditory image(s). Panels (a)–(c) show examples of individual subject responses. Panels (d)–(f) show the responses of all twenty subjects for the 3-mm, 1.5-mm, and CS PTs.

