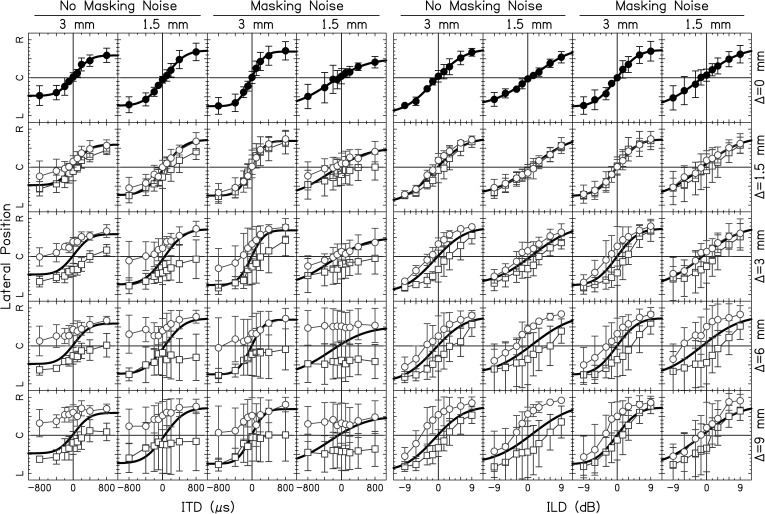
Figure 6.
(Color online) Lateralization data for ITDs (left four columns) and ILDs (right four columns) for different BWs. The vertical axis shows the response lateralization over the range of left ear (L) to center (C) to right ear (R). The top row shows conditions with Δ = 0 mm. Data points represent the average over the average response from each subject and errors bars shown ±1 standard deviation from the average. Mismatched conditions are plotted in the bottom four rows. Circles represent +Δ's; squares represent –Δ's. The solid line is the fit from the Δ = 0 mm condition.

