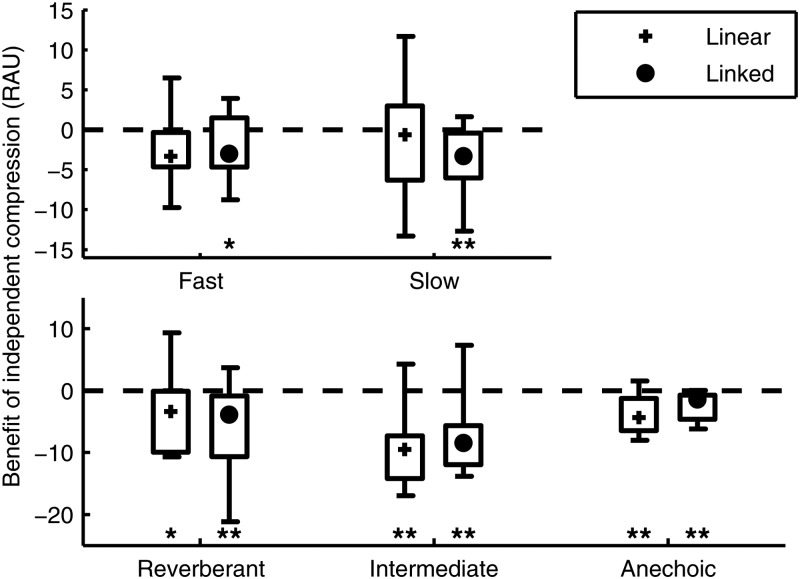
Figure 4.
Within-subject differences of RAU scores for linear (plusses) and linked compression (filled circles) relative to independent compression for 15° maskers. Symbols mark the medians of each data set, boxes indicate the inter-quartile range, and whiskers indicate the full range of results. Positive values indicate better performance compared to independent compression. Statistical significance was assessed by pairwise t-tests, and is marked with a * for p < 0.05 and ** for p < 0.01. Differences for 90° maskers were not significant for any group and are omitted for visual clarity.

