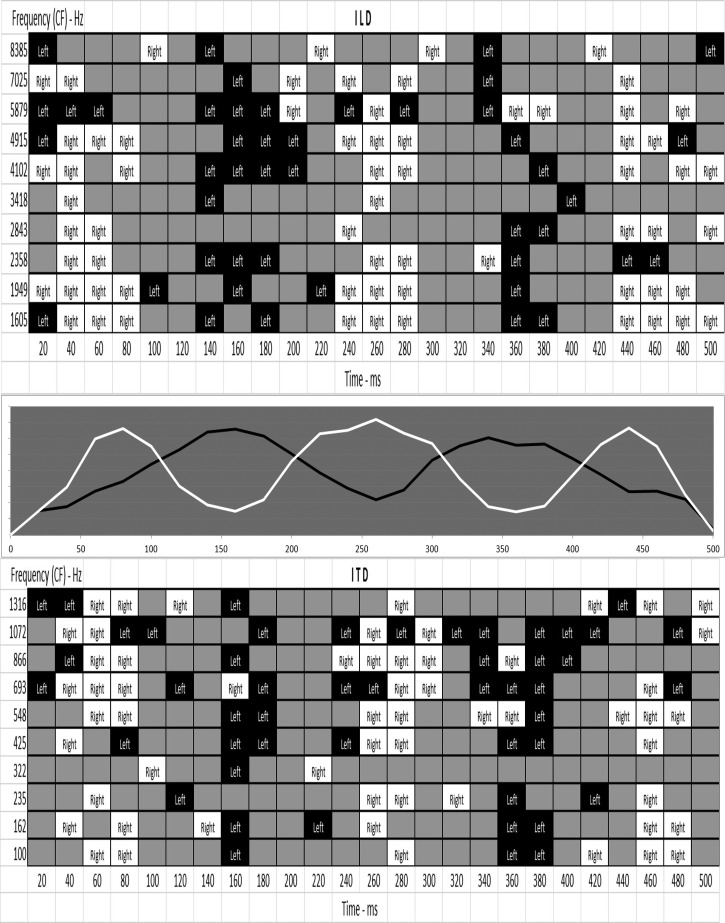
Figure 14.
A temporal-spectral matrix of the combined waveform from out-of-phase, 5-Hz SAM noise presented to loudspeakers 4 and 10 simultaneously. Each cell in the matrix is 20-ms long and one ERB wide. The cells that are black (left) are those with ITD or ILD values within +−10% of those measured in the same cell for the noise presented from just the left loudspeaker. The cells that are white (right) are those with ITD or ILD values within +10% of those for the same cell for the right loudspeaker. Gray cells represent cells with interaural values not within +−10% of the interaural values measured for either source when presented alone. (Bottom) ITD values were only tabulated for cells representing frequencies less than approximately 1350 Hz and (top) ILD values were only computed for cells representing frequencies greater than approximately 1600 Hz. (middle) The two out-of-phase SAM noise waveforms are shown.

