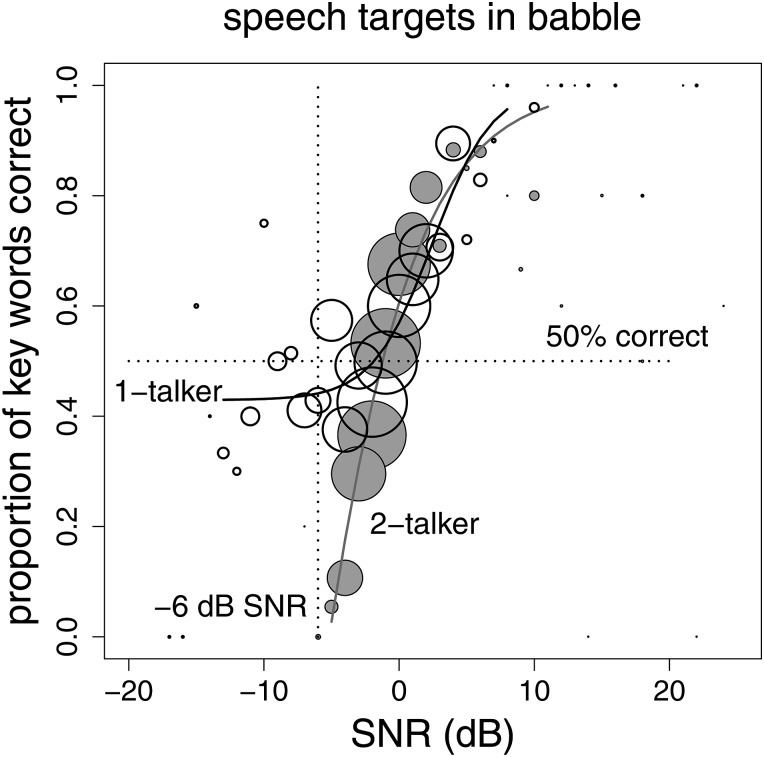
Figure 4.
PFs aggregated across all listeners repeating back unprocessed speech target sentences in the background of 1- and 2-talker babble. Responses to the first sentence in each adaptive track (when the SNR was increasing from a low value) were eliminated, as were 2.5% of the trials from the high and low end of the distribution of SNRs. The size of the plotted circles indicates the number of trials at that particular SNR. Also shown are the results of two separate logistic regressions which fit sigmoid-shaped function to each curve. Only the results for the 1-talker babble masker required the use of a lower plateau to the fitted sigmoid.

